
#AI Infrastructure Example: COVID-19 In-Hospital Deterioration
In this post, we dive into a real-world application of healthcare AI infrastructure by exploring the Michigan Critical Care Utilization and Risk Evaluation System (M-CURES). This project was developed during the early stages of the COVID-19 pandemic to predict in-hospital deterioration for patients suffering from acute respiratory failure.
This post builds on the broader concepts discussed in our previous posts on healthcare AI infrastructure. If you’re unfamiliar with the foundational ideas behind AI development and implementation, I recommend starting with the introduction to the healthcare AI lifecycle and the technical overview of healthcare AI infrastructure. These posts lay the groundwork for understanding how AI models are created and integrated into health systems, which will help contextualize the technical decisions made for M-CURES.
This post focuses on our technical integration challenges while implementing M-CURES using Epic’s internal tools and also demonstrates how you can parallelize development and integration. This parallelization enabled us to move quickly in a fast-moving, high-stakes environment like the early pandemic. By exploring the infrastructure and workflow that powered M-CURES, we’ll also highlight the importance of collaboration between AI developers and health system analysts.
This post builds off of our previous discussions on healthcare AI infrastructure. If you are unfamiliar with that infrastructure, reviewing the posts that cover the AI lifecycle or the general infrastructure landscape may be helpful.
The Need: Implement Quickly
In this post, we’ll discuss the technical side of the Michigan Critical Care Utilization and Risk Evaluation System (M-CURES) project. We developed M-CURES as an in-hospital deterioration prediction system for patients admitted to the hospital for acute respiratory failure during the initial onset of the COVID-19 pandemic.
In the early days of the pandemic, everyone was concerned with quickly triaging patients between different levels of care. We expected to see a massive influx of patients and wanted to be able to place them in the correct care setting (e.g., home, field hospital, regular hospital, ICU). To meet this anticipated need, Michigan Medicine leadership asked us to develop and implement a predictive model to help with triage.
The development of the model and external validation are covered in a paper we published in the BMJ.
We discussed implementation exceptionally early in the project to speed up the process. Within the first week, we decided to implement the model we developed using Epic’s tools (internal integration). Although it was our first time using Epic’s tooling, we felt it would give us the best chance at the fastest integration process. After we decided to go with Epic’s tooling, we started technical integration immediately. We did this work in parallel with model development to speed up the process as much as possible.
Epic’s Internal Integration Approaches
As mentioned in the development infrastructure post, Epic provides tooling to facilitate internal technical integration.
At the time we started the M-CURES project, Epic offered two options for internal integration:
- Epic Cognitive Computing Platform (ECCP) and
- Predictive Model Markup Language (PMML).
Epic’s PMML approach is interesting because it implements the model by specifying a model configuration (using the PMML standard). Epic builds/hosts a copy of the model based on their implementations of different model architectures. I have not built anything using this approach; however, my research at the time indicated that it was the more limited option, as only a handful of simple model architectures were supported.
Because of the model architecture limitations of PMML, we decided to go with ECCP for M-CURES. ECCP enables you to host custom Python models using Epic’s model-serving infrastructure. This model serving infrastructure is a sandboxed Python AI environment hosted using Microsoft Azure.
At a high level, data are passed from Chronicles to this Azure instance; the model runs and produces predictions, which are then passed back to Chronicles. ECCP takes care of the data transitions, and AI developers primarily only need to worry about their AI code.
Overview of ECCP
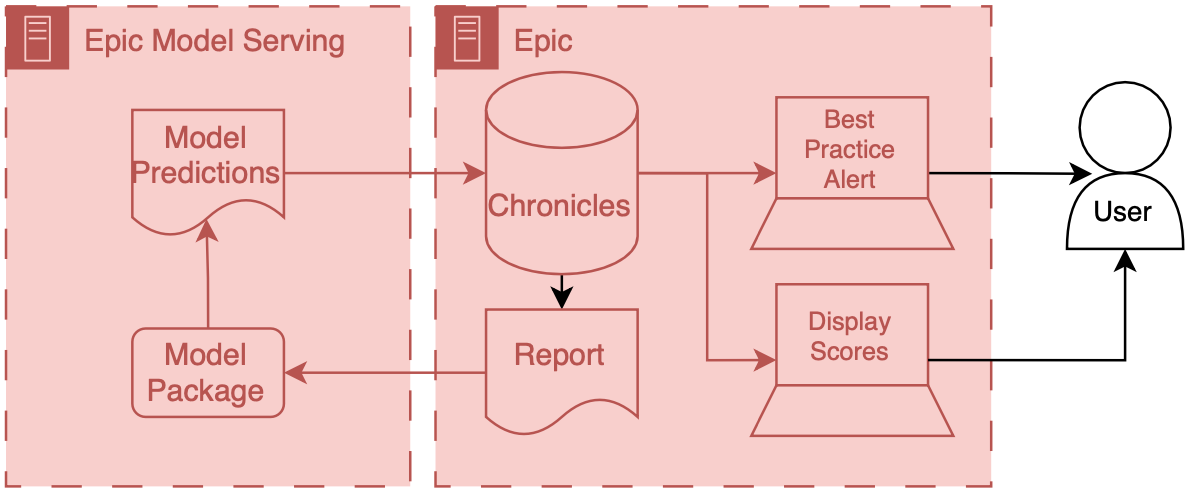
This infrastructure tightly integrates Epic’s various systems so that data can flow fairly seamlessly from Chronicles to the model and the end user.
Model input data is passed out of Chronicles using Reporting Workbench. Reporting Workbench is designed for different types of EMR reporting. Analysts can configure these reports to pull patient data that can be fed to AI models. Data are in a tabular structure1 where rows represent patients or encounters, and columns represent attributes like age, current heart rate, etc.
These data are then passed securely to the model, which runs on the Azure instance. The model developer can then include various code and outside data to produce model outputs and related metadata (like explainability scores). This information is passed back to Chronicles and ends up in a particular part of the database designed to store predictive model results.2
When the data is back in Chronicles, it can be served to users in several ways. For example, the information could trigger best practice alerts or rank and order a patient list according to risk. Building alerts and patient lists using the predictions is easy because we are working directly with Epic’s tools. Throughout the integration process, developers should liaise with health system analysts who are experts in configuring Epic’s systems. These analysts work with data directly in Chronicles and can then collaborate with their colleagues to set up the best practice alert or column display.
The entire flow of data from Chronicles to ECCP and back to Chronicles is tightly integrated and controlled, which yields good safety and reliability.
Chronicles Not Clarity
What’s crucial about the workflow described above is that there’s a data report that comes directly out of Chronicles (not Clarity) that you use as a part of this packaging workflow. This report often represents patients currently interacting with the health system (i.e., admitted patients). By definition, this set of patients/encounters will be much smaller than Clarity’s and other data warehouses’ corpus of retrospective patients/encounters. However, despite being smaller, it is a nearly perfect representation of what the data will look like prospectively, as the prospective infrastructure generates it and does not undergo any additional transformations.
Sandboxing
ECCP provides a Python environment with a load of standard Python AI/ML libraries (Numpy, Pandas, SKLearn, etc.) They also offer custom Python functions that help you interact with the data interfaces. These functions help with:
- Receiving inputs: They provide function calls to receive input data exported from Chronicles and parse it into a dataframe.
- Returning outputs: After you have model predictions, you can use their function calls to package results and send them back to Chronicles.
These functions help to bookend your model code and help developers automate data flow.
Although the ECCP environment is sandboxed, developers are not constrained in terms of the code they can include, as they can include additional Python and data files in the package. Additionally, developers can call external APIs within this environment (if the health system’s IT teams safelist them). External APIs enable developers to include information from other sources or process data via another service. Thus, converting an existing Python model for use with ECCP is relatively easy.
Model Development
We will now discuss the technical side of how we developed M-CURES using ECCP. Model development and validation details are in our BMJ paper. The short version is that model development primarily used Michigan Medicine’s research infrastructure. Although we obtained most of our training and internal validation data from Michigan Medicine’s Research Data Warehouse (RDW), Epic’s implementation infrastructure reshaped our model development approach.
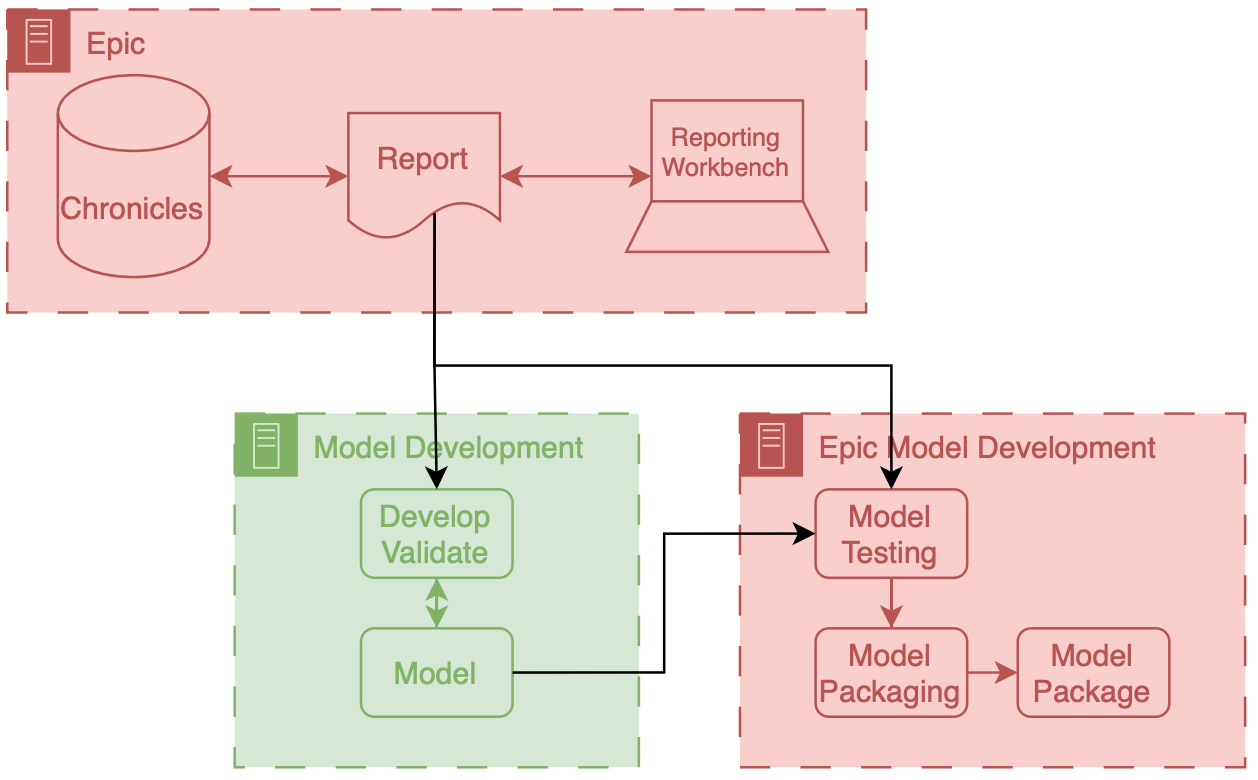
Reporting Workbench Report
Differences in data pipelines led to a shift in how we built the model. The research data pipeline we were familiar with for model development gave us a lot of control regarding pulling a wide array of features per patient. However, this control came at the cost of accessing very low-level data. We had to put significant development effort into getting the data in the right representational state. For example, we could easily pull all the meds and vitals for a patient encounter. But then, it was up to us to figure out how to filter and aggregate these data before feeding it into the model.
Epic’s reporting infrastructure for ECCP can be seen as “higher level,” where the balance between choice and preparation shifts. The available data through Reporting Workbench reports is limited, but the advantage of automated data filtering and aggregation offsets this restriction. For example, we can specify that we want the most recent vitals or check whether a patient has received beta-blocker medication. Another benefit of this approach is that these data elements are standardized across the health system’s Epic reporting infrastructure, so analysts only need to create a column or feature once.
On the whole, this is a great benefit. However, it does limit the choices available to developers. Initially, we chafed at this a little. But this was because we were so used to “rolling our own.” Standard data components that can be reused and maintained by the health system are the future. We just weren’t used to it.
We were assigned a small amount of analyst time for the M-CURES project to help build the Reporting Workbench report we would use. Because this was so limited, we included minimal features in the model. We selected features by performing several experiments with the training data (from RDW) and routinely checking with our analyst colleagues to ensure we could include them in the report. Through this iterative process, we ended up with the logistic regression model we wanted to use.
Epic Model Development Environment
At this stage, we had the model weights and Python code. To run the model in ECCP, we needed to package these components in a format compatible with the sandboxed Azure instance. This is where Epic’s model development environment, Slate, came into play.
The Slate tooling enables model developers to test and package their Python code. It’s an Epic-developed docker container replicating the Azure hosting environment. This environment has a battery of Python libraries commonly used for AI, like Numpy, Pandas, and SKLearn. It also has custom Epic functions that enable you to test and package the model.
After setting up Slate on our development servers, we ported our logistic regression model to it. Alongside the code, we also brought in an example report produced by our analyst. This example report enabled us to use Epic’s tools to conduct aggressive testing. Using the report, we tested the model with data that closely resembled what it would encounter in production, giving us insight into its real-world performance. These testing tools enabled us to understand how ECCP worked and debug our model and preprocessing code. I will describe one of the most valuable tests we conducted in a separate post on technical integration.
Once we were happy with how the model worked in the Slate testing environment, we used Epic’s tools to package the model and all the associated code.
Epic Implementation Environment
We then shared the packaged model with our Epic analyst colleague. In addition to the model package, there is some configuration that is needed when running the model in real time:
- Reporting Workbench report and
- model run information.
We connected the Reporting Workbench model discussed above to our configuration. Additionally, we instantiated the logic that controls the frequency at which the model runs. Our analysts created an Epic batch job that ran at a specified frequency.3 This job runs the Reporting Workbench reports and passes that data to the model process.
Once you have everything configured, you should be able to monitor the status of previous prediction jobs using Epic’s ECCP management dashboard. Additionally, analysts can kick off a one-time run of the model. This is very helpful for debugging, as errors in the Python runtime are displayed in the management dashboard.4
Workflow
After all the setup, our model began producing scores for all the eligible patients in the hospital every couple of hours. The predictions were filed to Chronicles and displayed as a risk score column for Michigan Medicine’s rapid response team. This team used the scores to screen patients at higher risk for deterioration.
Final Considerations
Our decision to do technical integration simultaneously with model development was significant. The learnings from technical integration directly impacted our choices for model development. For example, building the Reporting Workbench report was relatively laborious. Each column in the report took a reasonable amount of time to develop and validate. These columns corresponded to a variable (also known as a feature) the model took as input. So, the integration effort scaled linearly with the number of features we wanted to include in the model.
During the early stages of development, we explored models with thousands of features, as we had access to the features from RDW and had code to manage these features easily. However, once we learned more about the integration effort, we decided to cap the number of features used to a small number (around 10). We felt comfortable with this decision because we could balance performance and implementation time. Our early experiments indicated that we wouldn’t lose a ton of performance going from thousands of features to ten (something on the order of less than a 10% relative decrease in AUROC), and we were sure that we could implement and test the report with the allocated Epic analywouldn’t time.
One final consideration of the internal integration approach is that a significant amount of the model configuration is outside the direct control of the AI developers. Instead, a substantial portion of the configuration is under the purview of health system analysts. This division could be great if there is good communication between the two parties. However, there’s often a big disconnect. This disconnect is due to the siloed nature of healthcare IT and AI R&D. Analysts are siloed inside health system IT, and developers tend to be outside of direct health IT and structure. Usually, this devolves into a giant game of telephone, as these parties don’t usually talk to one another or have good relationships. So, as always, we need to work on our sociotechnical system. We can start by improving communication and tearing down silos.
Cheers,
Erkin
Go ÖN Home
-
This is where the non-tabular structure of healthcare data can pose challenges for AI novices. Since the underlying data in Chronicles isn’t organized in a tabular format—and because the best representation of longitudinal health data often isn’t tabular either—significant engineering is required to represent patients more accurately. ↩
-
The information you can pass back is limited because the database only expects certain types of information (e.g., integer or float). ↩
-
Care must be exercised with run frequency. I recommend thorough testing before changing the run frequency of a model. ↩
-
This was a helpful avenue to improve the way my Python code ran in ECCP, as I could write custom exceptions that passed back information about who my code was running. ↩