File: 2013-01-01-I-PrACTISE.md Creation Date: “Fri, 27 Feb 2026 19:13:30 +0000” — title: “I-PrACTISE” categories:
- Blog
tags:
- medicine
- healthcare
- primary care
- industrial engineering
- human factors engineering
- health systems engineering
excerpt: “Improving Primary Care Through Industrial and Systems Engineering”
Helped to create Improving Primary Care Through Industrial and Systems Engineering (I-PrACTISE) collaborative. I-PrACTISE is an educational and research collaborative focused on connecting problems in Primary Care with solutions from Industrial Engineering.
It is a formal partnership between the University of Wisconsin Department of Industrial and Systems Engineering, and the Departments of Family Medicine and Community Health, Medicine and Pediatrics of the UW School of Medicine and Public Health.
I-PrACTISE focuses on applying industrial engineering methods and systems thinking to primary care healthcare settings, aimed at improving patient outcomes while reducing costs and minimizing waste. By doing so, they seek to address some of the challenges facing modern healthcare delivery, which includes rising healthcare costs, limited resources, and burnout.
The goal of I-PrACTISE is to develop a home for cross-disciplinary research to foster development of innovative solutions that involve re-engineering existing clinical workflows and tools.
Vision
The care of patients will be improved and the practice of primary care medicine will become more efficient through new knowledge and techniques created by the collaboration between Industrial Engineering and the primary care specialties.
Mission
Create a home for scholars and clinicians with interest and expertise in industrial engineering and/or primary care to conduct funded projects directed at improving the quality of primary care for patients, clinicians and staff.
Membership
The membership consists of interested UW Faculty from the School of Medicine and Public Health and the Department of Industrial and Systems Engineering as well as interested scholars from other professions and institutions.
File: 2013-04-01-I-PrACTISE-White-Paper.md Creation Date: “Fri, 27 Feb 2026 19:13:30 +0000” — title: “I-PrACTISE White Paper” categories:
- Blog
- Research tags:
- Blog
- Research
- primary care
- medicine
- healthcare
- industrial engineering
- health system engineering
- human factors engineering
- I-PrACTISE excerpt: “Findings from the first I-PrACTISE conference bringing together physicians and engineers.” —
The first Improving PrimAry Care Through Industrial and Systems Engineering (I-PraCTISE) conference was held at Union South at the University of Wisconsin - Madison in April of 2013. It was funded by the Agency for Healthcare Research and Quality and co-sponsored by the UW - Madison Departments of Family Medicine and Industrial and Systems Engineering. A key objective of the first I-PrACTISE conference was to develop a cross-disciplinary research agenda, bringing together engineers and physicians.
I helped to organize themes from across the conference and created this paper to summarize our findings.
Abstract
Primary healthcare is in critical condition with too few students selecting careers, multiple competing demands stressing clinicians, and increasing numbers of elderly patients with multiple health problems. The potential for transdisciplinary research using Industrial and Systems Engineering (ISyE) approaches and methods to study and improve the quality and efficiency of primary care is increasingly recognized. To accelerate the development and application of this research, the National Collaborative to Improve Primary Care through Industrial and Systems Engineering (I-PrACTISE) sponsored an invitational conference in April, 2013 which brought together experts in primary care and ISyE. Seven workgroups were formed, organized around the principles of the Patient Centered Medical Home: Team-Based Care, Coordination and Integration, Health Information Technology (HIT) – Registries and Exchanges, HIT – Clinical Decision Support and Electronic Health Records, Patient Engagement, Access and Scheduling, and Addressing All Health Needs. These groups: (A) Explored critical issues from a primary care perspective and ISyE tools and methods that could address these issues; (B) Generated potential research questions; and (C) Described methods and resources, including other collaborations, needed to conduct this research.
Download paper.———————— File: 2015-01-31-SMS-Website.md Creation Date: “Fri, 27 Feb 2026 19:13:30 +0000” — title: “Send Me Specials Website” categories:
- Blog
- Project tags:
- software development
- startups
- business
excerpt: “Developed a custom text message gateway for businesses to reach their customers.”
In the days prior to wide smartphone adoption it was hard to find deals on meals and drinks as broke college students on the go.
![]()
SMS bottlecap logo
In order to enable restaurants and bars to reach out to college age customers Adam Maus and I created a custom text message gateway integrated with an application and website. These businesses could upload information about their menus and weekly specials and then share them with interested customers by sending out a text message blast.

SMS welcome screen
SMS gateway services existed at the time, but they were very expensive (i.e., you had to pay for each text). To avoid paying per text we got an android smartphone and had it serve as the text message router. We had a webservice that would pass information to an app on the smartphone which would then send text messages using its unlimited data and text plan.

SMS messaging screen
Ultimately, while we were technically successful this project didn’t really go anywhere. We were not addressing a pain point that businesses in Madison were experiencing. Students would have benefited, but they weren’t our “customers”. Cautionary tale on doing good customer discovery and working hard to achieve product-market fit. That’s more important than cool technology.
File: 2015-03-31-SHS-FlexSim.md Creation Date: “Fri, 27 Feb 2026 19:13:30 +0000” — title: “2015 FlexSim - SHS ED Modeling Competition” categories:
- Blog
- Project
- Research tags:
- operations research
- healthcare
- emergency medicine
- health system engineering
- simulation excerpt: “Modeling and optimizing the operations of an emergency department using discrete event simulation.” —
I led the University of Wisconsin team to victory in the inaugural FlexSim - SHS Emergency Department Modeling Competition in 2015. This international competition was sponsored by Flexsim Healthcare and took place at the 2015 Orlando Society for Health Systems conference. The team consisted of Samuel Schmitt, April Sell, Michael Russo and myself. We were advised by Dr. Brian Patterson and Dr. Laura Albert.
This case competition involved optimizing the operations of an emergency department (ED) using discrete event simulation and operations research tools. The goal was to analyze the Susquehanna Health ED’s current operations and determine the best care delivery model to meet productivity requirements while satisfying staffing and care constraints.
We used a combination of discrete event simulation (FlexSim healthcare software), design of experiments, and mathematical programming to determine the ideal care delivery model. See below for a copy of our winning presentation.
Executive Summary
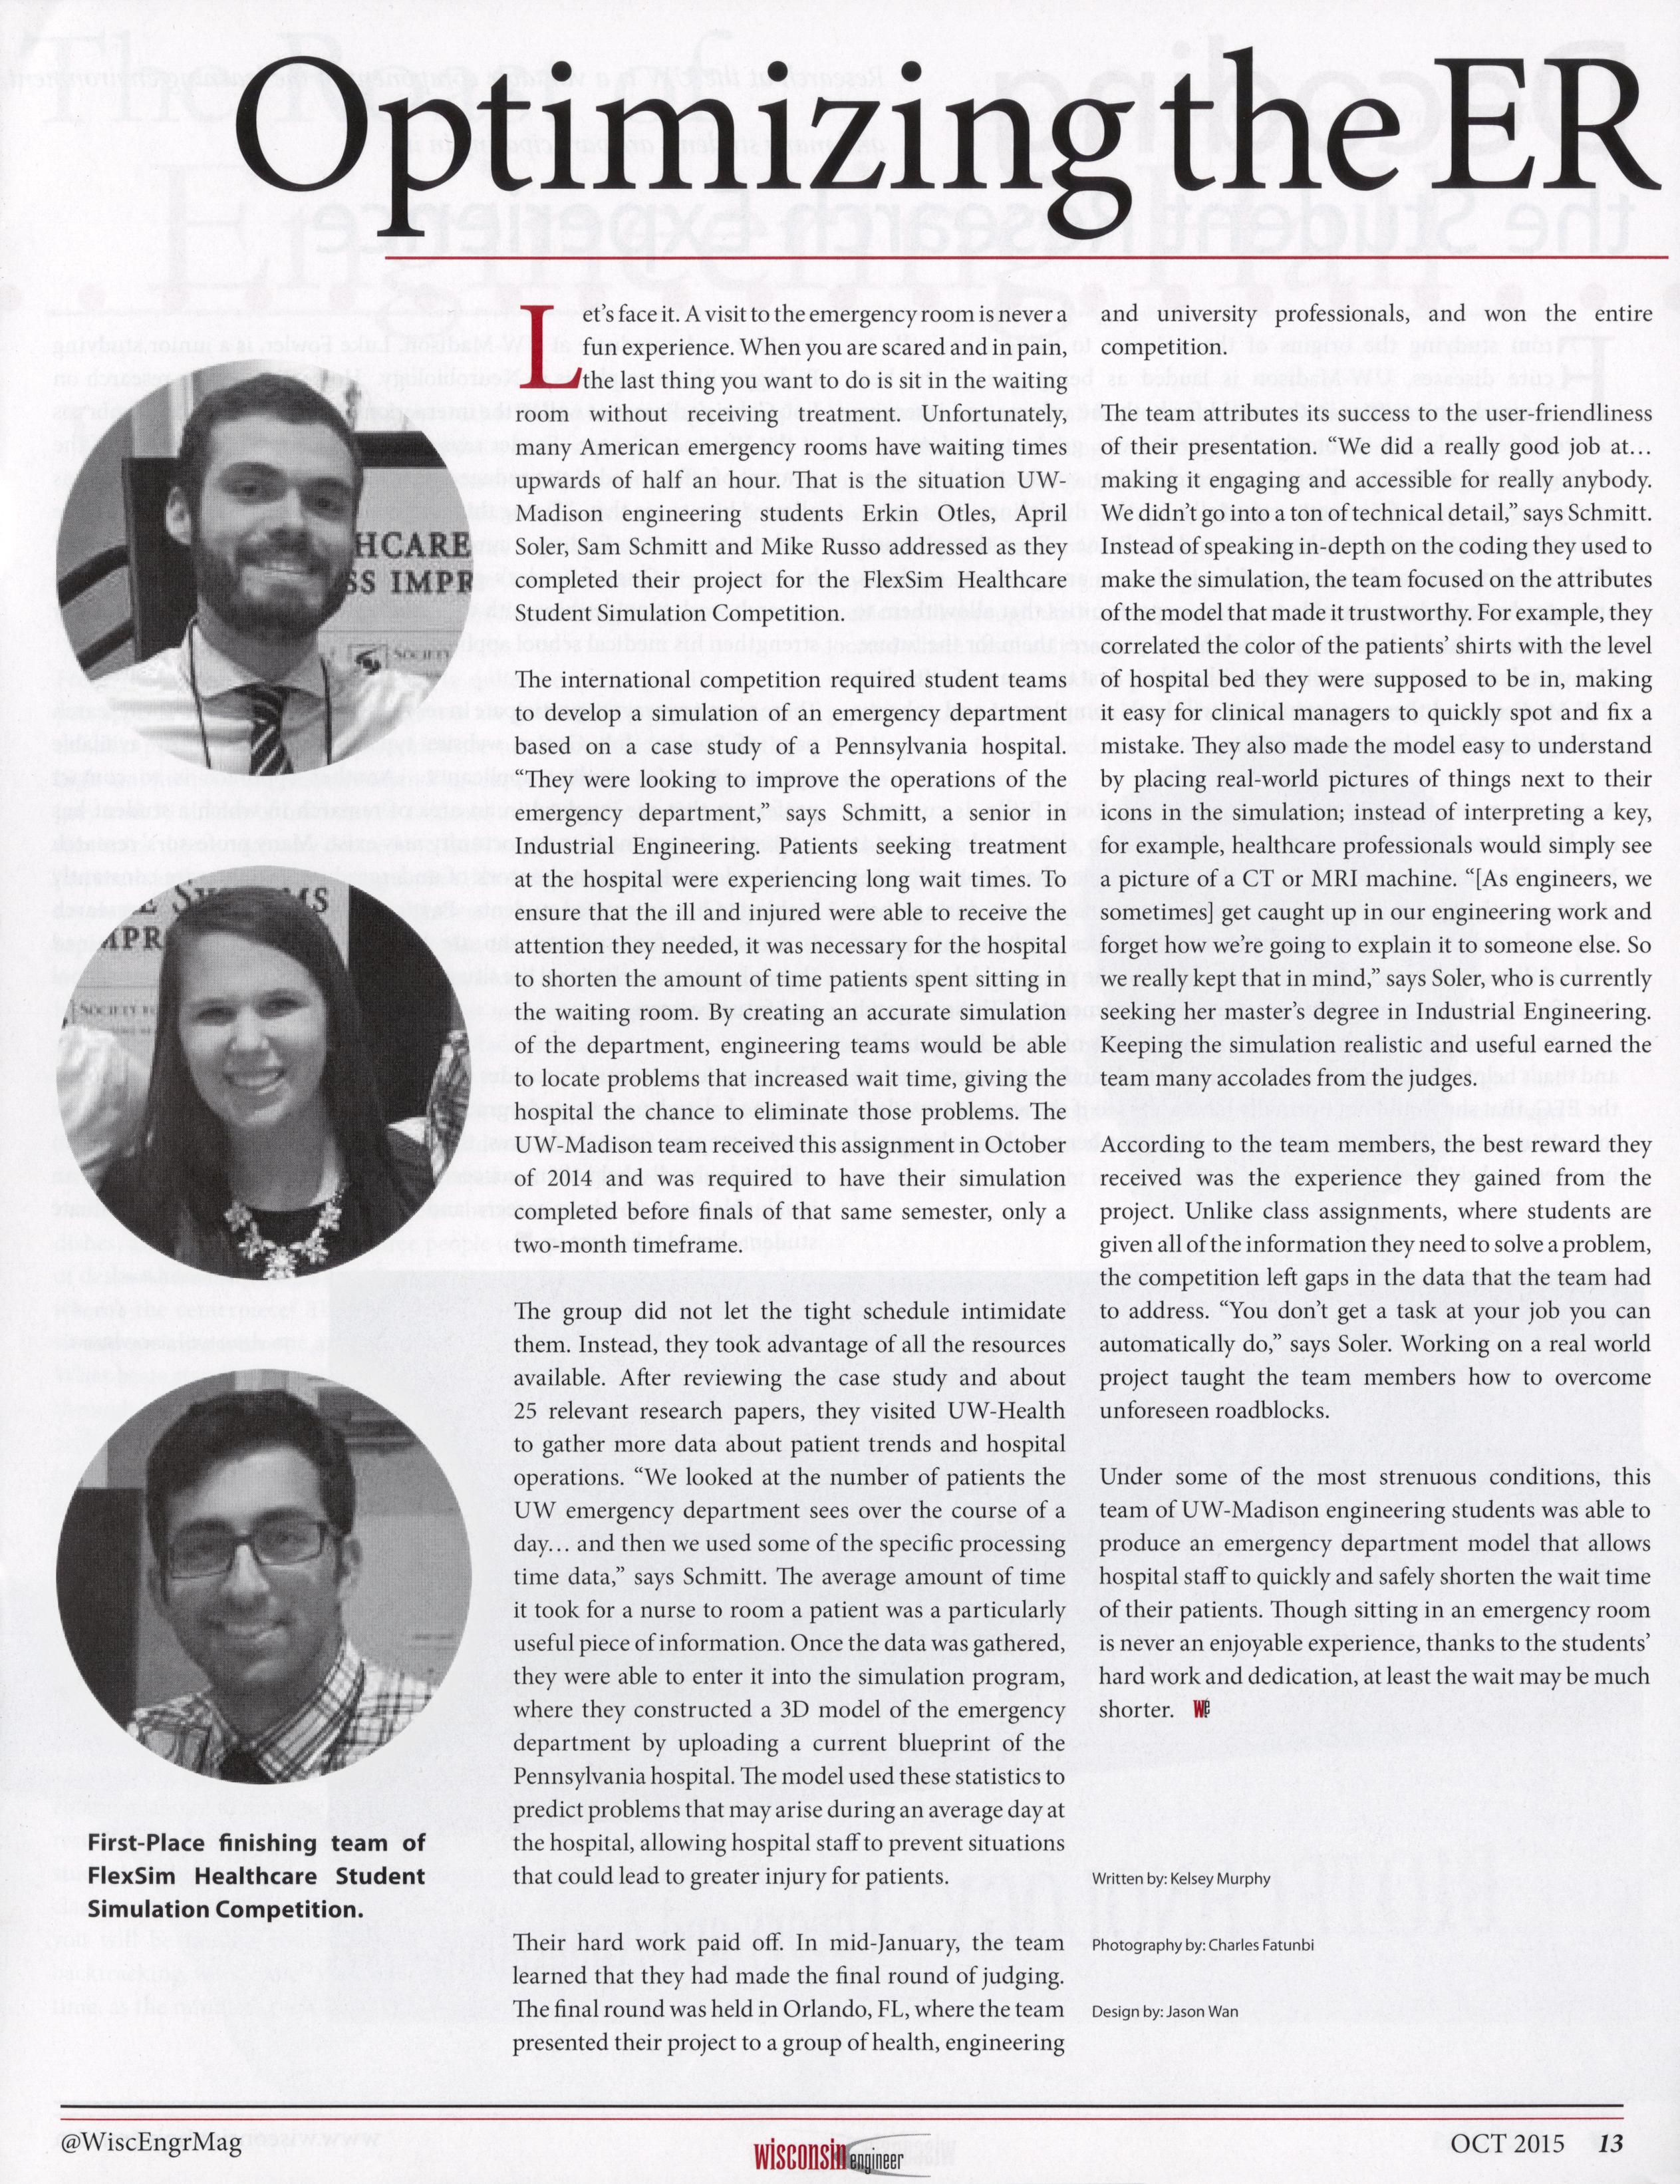
Susquehanna Health, a four‐hospital, not‐for‐profit health system, has deployed an Emergency Department (ED) Leadership Team to reduce expenses and optimize operations at their flagship hospital, Williamsport Regional Medical Center (WRMC). The Emergency Department has been experiencing pressure from a recently enacted marketing campaign that ensures patients are seen by a provider in 30 minutes or less at two competitor hospitals in the region. This campaign concerns Susquehanna Health because their current average door to provider time is 42.7 minutes with peak times as long as 140 minutes. As a result, 2.8% of their patients are leaving without being seen.
The Susquehanna Health System needs to be competitive in order to face today’s healthcare trends of declining reimbursement, increasingly high debt, and greater focus on outpatient services. The Emergency Department Leadership Team reached out to UW‐Madison’s Industrial & Systems Engineering students to assist them in creating a simulation that will help them improve patient safety, staff productivity, and overall efficiency.
The UW‐Madison Industrial & Systems Engineering students developed a discrete‐event simulation of WRMC Emergency Department’s traditional triage and bed process using FlexSim HC simulation software. Input data consisted of processing time distributions and probabilities supplied from the Emergency Department Leadership Team. To enhance the accuracy of the model, the team also collaborated with physicians at the University of Wisconsin Hospitals and Clinics (UWHC) to gather information on average processing times. Based on best practices in other institutions, simulation models were created to represent the two additional delivery methods: PITT and PITT/Super Fast Track.
After the modeling process was completed the team ran a series of experiments to determine the optimal delivery method and staffing levels. Super Fast Track appeared to be the best delivery system, however the team recommends that this analysis be redone on a more powerful machine. The machine used for modeling was not powerful enough to run the simulation experiments needed for statistical certainty.
The team views this as the first phase of a longer term project. The team will continue to refine the model and run new experiments once a new machine is procured. Collaborators at the UW – Madison, School of Medicine and Public Health, have asked the team to build a second set of models to be used for the UW Health ED.
Download paper.
File: 2015-10-12-Optimizing-the-ER.md Creation Date: “Fri, 27 Feb 2026 19:13:30 +0000” — title: “Wisconsin Engineer: Optimizing the ER” categories:
- Blog
- Press tags:
- Blog
- Press excerpt: “Article discussing Flexsim-SHS competition win.” —
April Sell, Samuel Schmitt, and I discussed our win at the Flexsim-SHS Emergency Department Modeling Competition with Kelsey Murphy for an article in the Wisconsin Engineer magazine.
File: 2015-10-31-Predicting-ED-Patient-Throughput.md Creation Date: “Fri, 27 Feb 2026 19:13:30 +0000” — title: “Predicting ED Patient Throughput Times Utilizing Machine Learning” categories:
- Blog
- Research tags:
- Blog
- Research
- emergency medicine
- medicine
- healthcare
- health system engineering
- artificial intelligence
- machine learning
- operations research excerpt: “Machine learning for emergency department throughput prediction.” —
Annals of Emergency Medicine research forum abstract. Work done in conjunction with Dr. Brian Patterson and Dr. Laura Albert. Link to paper.
Abstract
Study Objectives
Patient throughput time in the emergency department is a critical metric affecting patient satisfaction and service efficiency. We performed a retrospective analysis of electronic medical record (EMR) derived data to evaluate the effectiveness of multiple modeling techniques in predicting throughput times for patient encounters in an academic emergency department (ED). Analysis was conducted using various modeling techniques and on differing amounts of information about each patient encounter. We hypothesized that more comprehensive and inclusive models would provide greater predictive power.
Methods
Retrospective medical record review was performed on consecutive patients at a single, academic, university-based ED. Data were extracted from an EMR derived dataset. All patients who presented from January 1, 2011 to December 31, 2013 and met inclusion criteria were included in the analysis. The data were then partitioned into two sets: one for developing models (training) and a second for analyzing the predictive power of these models (testing). The Table lists model types used. The primary outcome measured was the ability of the trained models to accurately predict the throughput times of test data, measured in terms of mean absolute error (MAE). Secondary outcomes were R2 and mean squared error (MSE). Model factors included a mix of patient specific factors such as triage vital signs, age, chief complaint; factors representing the state of the ED such as census and running average throughput time; and timing factors such as time of day, day of week, and month. The most comprehensive models included a total of 29 distinct factors.
Results
Of the 134,194 patients that were seen in the 3-year period of the study 128,252 met the inclusion criteria; the mean throughput time was 183.327 min (SD 1⁄4 98.447 min). Compared to using a single average throughput time as a naïve model (MAE 1⁄4 80.801 min), univariate models provided improved predictive abilities. More sophisticated models, using machine learning methods and including all available factors provided greater predictive power with the lowest MAE achieved at 73.184 min.
Conclusion
We have demonstrated that including information about incoming patients and the state of the ED at the time of an arrival can aid in the prediction of individual patients’ throughput times. The Multiple Linear Regression model, including all available factors, had the highest predictive accuracy, reducing mean absolute error by over 9% compared to the naïve model. While this represents an improvement in the current state of the art, we believe there is room for further work to generate high quality individual patient predictions. More sophisticated models based on ED workflows may lead to greater predictive power to prospectively estimate patient throughput times at arrival.
Download paper. ———————— File: 2015-12-31-Arena-Simulation-Modeling-Course.md Creation Date: “Fri, 27 Feb 2026 19:13:30 +0000” — title: “Arena Simulation Modeling Course” categories:
- Blog
- Project
- Teaching tags:
- operations research
- simulation
- industrial engineering
- teaching
- Arena excerpt: “Discrete event simulation and operations modeling for undergrads.” —
I developed an online course to introduce the Arena simulation application. Arena is a discrete event simulation tool that is widely used throughout the field of industrial engineering. Despite its frequent use and inclusion in undergraduate curicula it is often not well understood by students. This is due to a lack of high quality training materials.
I taught an in-person simulation lab (ISyE 321) and assisted in teaching a theory of simulation course (ISyE 320) with Dr. Laura Albert in 2015 at the University of Wisconsin. During this time I developed a series of modules to show off the functionality of Arena. I subsequently recorded these modules and developed a free online course that is on youtube.
Here’s the first video in the online Arena course that I developed:
I also developed accompanying presentation slides, exercises, and Arena files. If you are interested in accessing these materials please contact me.
File: 2016-02-13-Cherry-Picking.md Creation Date: “Fri, 27 Feb 2026 19:13:30 +0000” — title: “Cherry Picking Patients: Examining the Interval Between Patient Rooming and Resident Self-assignment” categories:
- Blog
- Research tags:
- Blog
- Research
- machine learning
- artificial intelligence
- healthcare
- medicine
- electronic health record excerpt: “Investigating the impact of chief complaints on resident physician self-assignment times in emergency departments.” —
Study titled “Cherry Picking Patients: Examining the Interval Between Patient Rooming and Resident Self-assignment”. We aimed to evaluate the association between patient chief complaint and the time interval between patient rooming and resident physician self-assignment (“pickup time”). The team hypothesized that significant variation in pickup time would exist based on chief complaint, thereby uncovering resident preferences in patient presentations.[^1]
The authorship team consisted of Brian W. Patterson MD, MPH, Robert J. Batt PhD, Morgan D. Wilbanks MD, myself, Mary C. Westergaard MD, and Manish N. Shah MD, MPH.
Abstract
Objective
We aimed to evaluate the association between patient chief complaint and the time interval between patient rooming and resident physician self-assignment (“pickup time”). We hypothesized that significant variation in pickup time would exist based on chief complaint, thereby uncovering resident preferences in patient presentations.
Methods
A retrospective medical record review was performed on consecutive patients at a single, academic, university-based emergency department with over 50,000 visits per year. All patients who presented from August 1, 2012, to July 31, 2013, and were initially seen by a resident were included in the analysis. Patients were excluded if not seen primarily by a resident or if registered with a chief complaint associated with trauma team activation. Data were abstracted from the electronic health record (EHR). The outcome measured was “pickup time,” defined as the time interval between room assignment and resident self-assignment. We examined all complaints with >100 visits, with the remaining complaints included in the model in an “other” category. A proportional hazards model was created to control for the following prespecified demographic and clinical factors: age, race, sex, arrival mode, admission vital signs, Emergency Severity Index code, waiting room time before rooming, and waiting room census at time of rooming.
Results
Of the 30,382 patients eligible for the study, the median time to pickup was 6 minutes (interquartile range = 2–15 minutes). After controlling for the above factors, we found systematic and significant variation in the pickup time by chief complaint, with the longest times for patients with complaints of abdominal problems, numbness/tingling, and vaginal bleeding and shortest times for patients with ankle injury, allergic reaction, and wrist injury.
Conclusions
A consistent variation in resident pickup time exists for common chief complaints. We suspect that this reflects residents preferentially choosing patients with simpler workups and less perceived diagnostic ambiguity. This work introduces pickup time as a metric that may be useful in the future to uncover and address potential physician bias. Further work is necessary to establish whether practice patterns in this study are carried beyond residency and persist among attendings in the community and how these patterns are shaped by the information presented via the EHR.
Full Text
Bibliography
[^1]: Patterson, B. W., Batt, R. J., Wilbanks, M. D., Otles, E., Westergaard, M. C., & Shah, M. N. (2018). Cherry Picking Patients: Examining the Interval Between Patient Rooming and Resident Self-assignment. Academic Emergency Medicine, 25(7), 742-751.
File: 2016-05-31-Forecasting-ED-Patient-Admissions.md Creation Date: “Fri, 27 Feb 2026 19:13:30 +0000” — title: “Forecasting ED Patient Admissions Utilizing ML” categories:
- Blog
- Research tags:
- Blog
- Research
- emergency medicine
- medicine
- healthcare
- health system engineering
- artificial intelligence
- machine learning
- operations research excerpt: “Using machine learning to predict the likelihood of inpatient admission at the time of patient triage in emergency departments.” —
“Forecasting Emergency Department Patient Admissions Utilizing Machine Learning” was a clinical abstract submitted to Academic Emergency Medicine. In this study, we aimed to predict the need for admission at the time of patient triage utilizing data already available in the electronic health record (EHR). We performed a retrospective analysis of EHR-derived data to evaluate the effectiveness of machine learning techniques in predicting the likelihood of admission for patient encounters in an academic emergency department. We hypothesized that more comprehensive & inclusive models would provide greater predictive power.
This work was done in conjunction with Dr. Brian Patterson, Dr. Jillian Gorski, and Dr. Laura Albert.
Abstract
Background
Multiple studies have identified inpatient bed availability as a key metric for Emergency Department operational performance. Early planning for patient admissions may allow for optimization of hospital resources.
Objectives
Our study aimed to predict the need for admission at the time of patient triage utilizing data already available in the electronic health record (EHR). We performed a retrospective analysis of EHR derived data to evaluate the effectiveness of machine learning techniques in predicting the likelihood of admission for patient encounters in an academic emergency department. We hypothesized that more comprehensive & inclusive models would provide greater predictive power.
Methods
All patients who presented from 1/1/2012 to 12/31/2013 and met inclusion criteria were included in the analysis. The data were then partitioned into two sets for training and testing. The primary outcome measured was the ability of the trained models to discern the future admission status of an encounter, measured in terms of area under the receiver operator curve (ROC AUC). A secondary outcome was accuracy (ACC). Model features included a mix of patient specific factors (demographics, triage vital signs, visit and chief complaint history), the state of the ED (census and other performance metrics); and timing factors (time of day, etc.). The most comprehensive models included 682 variables, encoding 328 features, aggregated into 3 feature groups.
Results
Our final analysis included 91,060 patient encounters. 28,838 (31.7%) of these encounters resulted in an inpatient admission. Compared to using a naïve model, single feature group models provided improved predictive abilities (1.8% - 50.8% improvement in ROC AUC), see figure for details. More sophisticated models, including all available feature groups provided greater predictive power with the greatest achieved at ROC AUC score of 0.756.
Conclusion
We have demonstrated that including information about incoming patients and the state of the ED at the time of triage can aid in the prediction of individual patients’ likelihood of admission. More sophisticated models using claims, weather, and social media data may lead to greater predictive power to prospectively estimate patient admission likelihood at arrival.
Full Text
Download paper.
File: 2016-06-31-I-PrACTISE-Colloquia-Primary-Care-Predictive-Analytics.md Creation Date: “Fri, 27 Feb 2026 19:13:30 +0000” — title: “I-PrACTISE Colloquium Primary Care & Predictive Analytics” categories:
- Blog
- Talk tags:
- primary care
- medicine
- healthcare
- machine learning
- artificial intelligence
- operations research
- industrial engineering excerpt: “Exploring the potential benefits and challenges of integrating ML into primary care.” —
I had the opportunity to give a talk titled “Primary Care & Predictive Analytics” as a part of the I-PrACTISE colloquia series. We discussed artificial intelligence/machine learning and their applications in medicine, with a particular focus on primary care. In the presentation, I aimed to demystify machine learning, discuss its potential benefits in healthcare, and address the challenges associated with implementing these cutting-edge techniques.
What is Machine Learning?
Machine learning is a discipline that explores the construction and study of algorithms that can learn from data. These algorithms improve their performance at specific tasks as they gain experience, which is often measured in terms of data. In my talk, I explained the concept of machine learning by drawing parallels between training an algorithm and training an undergraduate. Just as we teach undergraduates general concepts and facts that they then synthesize and apply to specific situations, we train algorithms using data to improve their performance at a given task.
Applications in Medicine and Primary Care
Machine learning has the potential to revolutionize the field of medicine, and primary care is no exception. By leveraging vast amounts of data, we can train algorithms to predict patient outcomes, diagnose conditions more accurately, and identify potential treatment options. For example, we could use machine learning to analyze tumor samples and train a model to evaluate new samples, helping doctors make more informed decisions about cancer diagnosis and treatment.
Challenges and Considerations
Despite its potential, there are several challenges to integrating machine learning into healthcare, particularly in sensitive areas like primary care. One of the key issues I addressed in my talk is the need for collaboration between engineers, computer scientists, statisticians, and healthcare professionals to ensure that these advanced techniques are applied responsibly and effectively.
Additionally, it is crucial to consider the human factors involved in implementing machine learning in healthcare settings. Understanding how healthcare providers interact with and use these algorithms is essential to ensuring their successful integration into medical practice.
Looking Ahead
As we continue to explore the potential of machine learning in primary care and the broader medical field, it is vital to remain focused on responsible development and implementation. By collaborating across disciplines and considering the human factors involved, we can work towards harnessing the power of machine learning to improve patient outcomes and revolutionize healthcare.
Video
File: 2016-07-01-Metastar-Community-Pharmacy_Initiative.md Creation Date: “Fri, 27 Feb 2026 19:13:30 +0000” — title: “A community pharmacy initiative to decrease hospital readmissions by increasing patient adherence and competency of therapy” categories:
- Blog
- Research tags:
- Blog
- Research
- medicine
- healthcare
- industrial engineering
- health system engineering
- data science
- quality improvement excerpt: “Pharmacy based interventions may help to reduce hospital admissions.” —
While working as the lead data scientist at MetaStar I helped to analyze the impact of a community pharmacy based intervention to reduce the rate of hospital admissions and readmissions. Patients enrolled in the intervention had the community pharamcy deliver medications to the homes of patients and educate them as well. We found that enrolling patients in the program reduced their rate of admissions.
Abstract
Background
Direct pharmacist care has been associated with substantial reduction in hospital admission and readmission rates and other positive outcomes, as compared with the absence of such care.
Objective
To decrease readmissions for community pharmacy patients through a program of improved medication packaging, delivery and patient education.
Design
Comparison of the number of admissions and readmissions for each patient enrolled in the program, comparing the time elapsed since enrollment with the equivalent period prior to enrollment.
Setting
A community pharmacy in Kenosha, Wisconsin.
Patients
Medicare beneficiaries served by the community pharmacy conducting the intervention. This includes 263 patients, 167 of which are Medicare beneficiaries, who have been placed in the intervention group as of June 2016.
Intervention
A voluntary program to package medications according to patient-specific characteristics and physician orders, to deliver medication to patients’ homes, and to educate and follow up with patients regarding problems with adherence.
Measurements
Hospital admissions and readmissions post-enrollment as compared with the equivalent pre-enrollment period.
Results
An analysis that limits the study period to a year centered on the patient’s enrollment date in the PACT intervention found a highly statistically significant (p < 0.01) reduction in admissions. An analysis that included the entire duration of the patient’s enrollment in PACT also found a statistically significant (p < 0.001) reduction in admissions. However, neither analytic technique found a statistically significant reduction in readmissions (p=0.2 and 0.1 respectively).
Limitations
That the study was unable to show a decrease in readmissions to accompany the decrease in admissions may be due to the success of the intervention in decreasing the denominator as well as the numerator of the readmissions measure. In addition, the study has not stratified for changes in the intervention over time, and for differences in patient characteristics or outcomes other than admissions and readmissions.
Full Text
File: 2016-08-01-INFORMS-in-the-News.md Creation Date: “Fri, 27 Feb 2026 19:13:30 +0000” — title: “Quoted in INFORMS in the News” categories:
- Blog
- Press tags:
- Blog
- Press excerpt: “Starting a new INFORMS student chapter.” —
Over the course of the 2015-2016 school year I worked with several other students to start a student chapter of INFORMS at UW - Madison. After putting together bylaws and dealing with red tape we got the new student organization started. Additionally, was quoted in INFORMS in the News regarding setting up the University of Wisconsin student INFORMS chapter.
File: 2016-09-19-Impact-of-ED-Census-on-Admission.md Creation Date: “Fri, 27 Feb 2026 19:13:30 +0000” — title: “The Impact of ED Census on the Decision to Admit” categories:
- Blog
- Research tags:
- Blog
- Research
- machine learning
- artificial intelligence
- healthcare
- medicine
- electronic health record
- operations research
- health system engineering excerpt: “Emergency Department disposition decisions are influenced not only by objective measures of a patient’s disease state, but also by census.” —
Academic Emergency Medicine paper studying the impact of ED census on admission decisions: The Impact of Emergency Department Census on the Decision to Admit.
Jillian K. Gorski, Robert J. Batt, PhD, myself, Manish N. Shah, MD MPH, Azita G. Hamedani MD, MPH, MBA, and Brian W. Patterson MD, MPH, studied the impact of emergency department (ED) census on disposition decisions made by ED physicians. Our findings reveal that disposition decisions in the ED are not solely influenced by objective measures of a patient’s condition, but are also affected by workflow-related concerns.
The retrospective analysis involved 18 months of all adult patient encounters in the main ED at an academic tertiary care center. The results demonstrated that both waiting room census and physician load census were significantly associated with an increased likelihood of patient admission. This highlights the need to consider workflow-related factors when making disposition decisions, in order to ensure optimal patient care and resource allocation in emergency departments.
Abstract
Objective
We evaluated the effect of emergency department (ED) census on disposition decisions made by ED physicians.
Methods
We performed a retrospective analysis using 18 months of all adult patient encounters seen in the main ED at an academic tertiary care center. Patient census information was calculated at the time of physician assignment for each individual patient and included the number of patients in the waiting room (waiting room census) and number of patients being managed by the patient’s attending (physician load census). A multiple logistic regression model was created to assess the association between these census variables and the disposition decision, controlling for potential confounders including Emergency Severity Index acuity, patient demographics, arrival hour, arrival mode, and chief complaint.
Results
A total of 49,487 patient visits were included in this analysis, of whom 37% were admitted to the hospital. Both census measures were significantly associated with increased chance of admission; the odds ratio (OR) per patient increase for waiting room census was 1.011 (95% confidence interval [CI] = 1.001 to 1.020), and the OR for physician load census was 1.010 (95% CI = 1.002 to 1.019). To put this in practical terms, this translated to a modeled rise from 35.3% to 40.1% when shifting from an empty waiting room and zero patient load to a 12-patient wait and 16-patient load for a given physician.
Conclusion
Waiting room census and physician load census at time of physician assignment were positively associated with the likelihood that a patient would be admitted, controlling for potential confounders. Our data suggest that disposition decisions in the ED are influenced not only by objective measures of a patient’s disease state, but also by workflow-related concerns.
Full Text
File: 2016-10-01-Cues-for-PE-diagnosis-in-the-ED.md Creation Date: “Fri, 27 Feb 2026 19:13:30 +0000” — title: “Cues for PE Diagnosis in the Emergency Department: A Sociotechnical Systems Approach for Clinical Decision Support” categories:
- Blog
- Research tags:
- Blog
- Research
- emergency medicine
- medicine
- healthcare
- health system engineering
- human factors engineering excerpt: “American Medical Informatics Association Annual Symposium abstract focused on pulmonary embolism diagnosis.” —
American Medical Informatics Association Annual Symposium abstract. Work done in conjunction with Dr. Brian Patterson, MD MPH, Ann Schoofs Hundt, MS, Peter Hoonakker, PhD, and Pascale Carayon, PhD.
Pulmonary embolism (PE) diagnosis presents a significant challenge for emergency department (ED) physicians, as both missed or delayed diagnosis and overtesting can have serious consequences for patients. The implementation of health information technology, such as clinical decision support systems, has the potential to mitigate diagnostic errors and enhance the overall diagnostic process. However, to achieve this, the technology must be practical, user-friendly, and seamlessly integrate into clinical workflows. This calls for a sociotechnical systems approach to understand the cues involved in the PE diagnosis process and how they relate to the information available in electronic health records (EHRs).
In this study, we sought to comprehend the cues in the PE diagnosis process within the ED sociotechnical system and compare them to the information found in the EHR. The objective was to establish design requirements for clinical decision support for PE diagnosis in the ED.
Abstract
Pulmonary embolus (PE) is among the most challenging diagnoses made in the emergency department (ED). While missed or delayed diagnosis of PE is a major problem in the ED1, overtesting, which subjects patients to harm from radiation, overdiagnosis, and increased cost, is also a concern. Health information technology, such as clinical decision support, has the potential to reduce diagnostic errors and support the diagnostic process. However, this requires that the technology be useful and usable, and fit within the clinical workflow, providing justification for a sociotechnical systems approach. The purpose of this study is to understand cues in the PE diagnosis process in the ED sociotechnical system and to compare these cues to the information available in the EHR. This will help in defining design requirements for a clinical decision support for PE diagnosis in the ED. Using the Critical Decision Method, we interviewed 16 attending physicians and residents in three EDs of two academic medical centers and one community hospital. The total duration of the interviews was over 12 hours. Using an iterative qualitative content analysis, we identified 4 categories of cues: (1) patient signs and symptoms (e.g., leg swelling, chest pain), (2) patient risk factors (e.g., immobilization, surgery or trauma, cancer), (3) explicit risk scoring (e.g., PERC), and (4) clinical judgment. We then mapped these cues to information available in the EHR at one of the participating hospitals. About 80-90% of the cues may be available in the EHR; many of them rely on the physical exam and information obtained by talking to the patient. This finding underlines the need to identify the various roles involved in obtaining, documenting and reviewing the information that informs the PE diagnostic process. The PE diagnostic process in the ED is distributed across multiple roles, individuals and technologies in a sometimes chaotic and often busy physical and organizational environment.
Full Text
File: 2016-12-13-WHO-human-factors.md Creation Date: “Fri, 27 Feb 2026 19:13:30 +0000” — title: “WHO Technical Series on Safer Primary Care: Human Factors” categories:
- Blog
- Research tags:
- Blog
- Research
- primary care
- medicine
- healthcare
- industrial engineering
- health system engineering
- human factors engineering
- I-PrACTISE excerpt: “Human factors engineering can play an important role in improving the safety of primary care.” —
Tosha Wetterneck, MD MS, Richard Holden, PhD, John Beasley, MD, and myself wrote a technical chapter for the World Health Organization. Link to technical chapter.
Its part of the World Health Organization’s technical series on safer primary care, and has a particular focus on human factors. This report highlights the crucial role that human factors play in ensuring patient safety, improving the quality of care, and optimizing the overall efficiency of primary care systems. By understanding the interaction between humans, systems, and technologies, healthcare organizations can implement more effective strategies to reduce errors, enhance communication, and ultimately improve patient outcomes.
This monograph describes what “human factors” are and what relevance this approach has for improving safety in primary care. This section defines human factors. The next sections outline some of the key human factors’ issues in primary care and the final sections explore potential practical solutions for safer primary care.
Full Text
Download technical chapter. ———————— File: 2017-12-31-M-is-for-Medicine.md Creation Date: “Fri, 27 Feb 2026 19:13:30 +0000” — title: “M is for Medicine” categories:
- Blog
- Project tags:
- iOS
- mobile development
- software development
-
Apple
I developed an an iMessage Sticker Pack for all those interested in medicine, health, and the human body. Download it from the Apple AppSore.
File: 2018-01-18-Immune-Genomic-Expression-Correlates-Outcomes-in-Trauma-Patients.md Creation Date: “Fri, 27 Feb 2026 19:13:30 +0000” — title: “Immune Genomic Expression Correlates with Discharge Location and Poor Outcomes in Trauma Patients” categories:
- Blog
- Research tags:
- Blog
- Research
- trauma surgery
- genomics
- medicine
-
healthcare
Academic Surgical Congress abstract, can be found here.
Download abstract.
File: 2019-05-20-AAFP-Innovation-Fellow.md Creation Date: “Fri, 27 Feb 2026 19:13:30 +0000” — title: “AAFP’s Innovation Fellow Studies Tech, Digital Scribes” categories:
- Blog
- Press tags:
- Blog
-
Press
Discussed my work studying digital scribes with David Mitchell. Read the interview.
File: 2019-08-10-RTW-after-injury-sequential-prediction-and-decision.md Creation Date: “Fri, 27 Feb 2026 19:13:30 +0000” — title: “Return to Work After Injury: A Sequential Prediction & Decision Problem” categories:
- Blog
- Research tags:
- Blog
- Research
- occupational health
- return to work
- medicine
- healthcare
- artificial intelligence
-
machine learning
Machine Learning for Healthcare Conference clinical abstract, can be found here.
Download abstract.
File: 2020-04-20-COVID-Staffing-Project.md Creation Date: “Fri, 27 Feb 2026 19:13:30 +0000” — title: “COVID Staffing Project: Three Medical Students’ Contributions” categories:
- Blog
- Press tags:
- Blog
-
Press
Kenneth Abbott, Alexandra Highet and I catalogued our contributions to the COVID Staffing project in a Dose of Reality Blog Post.
File: 2020-04-22-COVID-19-Visualization.md Creation Date: “Fri, 27 Feb 2026 19:13:30 +0000” — title: “COVID-19 Analysis” categories:
- Blog
- Project tags:
- data science
-
covid
Quick exploration of case spread and mortality rates of the novel coronavirus.
Tableau embed code courtesy of San Wang.
File: 2020-05-12-Faster-than-COVID.md Creation Date: “Fri, 27 Feb 2026 19:13:30 +0000” — title: “Faster than COVID: a computer model that predicts the disease’s next move” categories:
- Blog
- Press tags:
- Blog
- Press
- covid
- artificial intelligence
- machine learning
-
early warning system
Michigan Engineering News covered our work on the M-CURES COVID deterioration model that I helped to develop and led the implementation of. Read the article here.
File: 2020-05-29-AADL-Friday-Night-AI.md Creation Date: “Fri, 27 Feb 2026 19:13:30 +0000” — title: “Ann Arbor District Library - Friday Night AI: AI and COVID-19” categories:
- Blog
- Talk tags:
- medicine
- healthcare
- covid
- machine learning
- artificial intelligence
-
operations research
Virtual panel discussion on how artificial intelligence could guide the response to the coronavirus outbreak. Hosted by the Ann Arbor District Library. Panel included speakers from across the Michigan AI and Michigan Medicine.
File: 2020-05-30-its-time-to-bring-human-factors-to-primary-care.md Creation Date: “Fri, 27 Feb 2026 19:13:30 +0000” — title: “It’s time to bring human factors to primary care policy and practice” categories:
- Blog
- Research tags:
- Blog
- Research
- primary care
- medicine
- healthcare
- industrial engineering
- health system engineering
- human factors engineering
-
I-PrACTISE
Appeared in Applied Ergonomics. Link
Abstract
Primary health care is a complex, highly personal, and non-linear process. Care is often sub-optimal and professional burnout is high. Interventions intended to improve the situation have largely failed. This is due to a lack of a deep understanding of primary health care. Human Factors approaches and methods will aid in understanding the cognitive, social and technical needs of these specialties, and in designing and testing proposed innovations. In 2012, Ben-Tzion Karsh, Ph.D., conceived a transdisciplinary conference to frame the opportunities for research human factors and industrial engineering in primary care. In 2013, this conference brought together experts in primary care and human factors to outline areas where human factors methods can be applied. The results of this expert consensus panel highlighted four major research areas: Cognitive and social needs, patient engagement, care of community, and integration of care. Work in these areas can inform the design, implementation, and evaluation of innovations in Primary Care. We provide descriptions of these research areas, highlight examples and give suggestions for future research. ———————— File: 2020-09-23-UM-Precision-Health-Symposium.md Creation Date: “Fri, 27 Feb 2026 19:13:30 +0000” — title: “UMich Precision Health Symposium: Prediction & Prevention - Powering Precision Health” categories:
- Blog
- Talk tags:
- medicine
- healthcare
- precision health
- machine learning
- artificial intelligence
-
operations research
Virtual panel discussion on precison health. A video segment from the 2020 University of Michigan Precision Health Virtual Symposium.
File: 2020-11-13-UM-Precision-Health-Onboarding-Session.md Creation Date: “Fri, 27 Feb 2026 19:13:30 +0000” — title: “UMich Precision Health Onboarding Session: Precision Health De-Identified RDW” categories:
- Blog
- Talk tags:
- medicine
- healthcare
- precision health
- machine learning
- artificial intelligence
-
operations research
Precision Health Data Analytics & IT workgroup held an onboarding session for Engineering students who could use Precision Health tools and resources for their classes and research. I provided a technical demonstration on how to find and query the database through the sql server.
File: 2021-05-19-UMich-MSTP-Promo-Video.md Creation Date: “Fri, 27 Feb 2026 19:13:30 +0000” — title: “UMich MSTP Promo Video” categories:
- Blog
- Press tags:
- Blog
- Press
- medicine
-
MSTP
Was featured in the University of Michigan Medical Scientist Training Program recruiting video.
The MSTP at Michigan prepares physician scientists for careers in academic medicine with a focus on biomedical research. More than just an M.D. and Ph.D. spliced together, our program offers comprehensive support and guidance, integrating academic excellence and flexibility to help you reach your career goals.
File: 2021-07-21-External-Validation-of-a-Widely-Implemented-Proprietary-Sepsis-Prediction-Model-in-Hospitalized-Patients.md Creation Date: “Fri, 27 Feb 2026 19:13:30 +0000” — title: “External Validation of a Widely Implemented Proprietary Sepsis Prediction Model in Hospitalized Patients” categories:
- Blog
- Research tags:
- Blog
- Research
- sepsis
- deterioration index
- Epic
- early warning system
- medicine
- healthcare
- artificial intelligence
-
machine learning
JAMA Internal Medicine. Can be found here.
Key Points
Question
How accurately does the Epic Sepsis Model, a proprietary sepsis prediction model implemented at hundreds of US hospitals, predict the onset of sepsis?
Findings
In this cohort study of 27 697 patients undergoing 38 455 hospitalizations, sepsis occurred in 7% of the hosptalizations. The Epic Sepsis Model predicted the onset of sepsis with an area under the curve of 0.63, which is substantially worse than the performance reported by its developer.
Meaning
This study suggests that the Epic Sepsis Model poorly predicts sepsis; its widespread adoption despite poor performance raises fundamental concerns about sepsis management on a national level.
Abstract
Importance
The Epic Sepsis Model (ESM), a proprietary sepsis prediction model, is implemented at hundreds of US hospitals. The ESM’s ability to identify patients with sepsis has not been adequately evaluated despite widespread use.
Objective
To externally validate the ESM in the prediction of sepsis and evaluate its potential clinical value compared with usual care.
Design, Setting, and Participants
This retrospective cohort study was conducted among 27 697 patients aged 18 years or older admitted to Michigan Medicine, the academic health system of the University of Michigan, Ann Arbor, with 38 455 hospitalizations between December 6, 2018, and October 20, 2019.
Exposure
The ESM score, calculated every 15 minutes.
Main Outcomes and Measures
Sepsis, as defined by a composite of (1) the Centers for Disease Control and Prevention surveillance criteria and (2) International Statistical Classification of Diseases and Related Health Problems, Tenth Revision diagnostic codes accompanied by 2 systemic inflammatory response syndrome criteria and 1 organ dysfunction criterion within 6 hours of one another. Model discrimination was assessed using the area under the receiver operating characteristic curve at the hospitalization level and with prediction horizons of 4, 8, 12, and 24 hours. Model calibration was evaluated with calibration plots. The potential clinical benefit associated with the ESM was assessed by evaluating the added benefit of the ESM score compared with contemporary clinical practice (based on timely administration of antibiotics). Alert fatigue was evaluated by comparing the clinical value of different alerting strategies.
Results
We identified 27 697 patients who had 38 455 hospitalizations (21 904 women [57%]; median age, 56 years [interquartile range, 35-69 years]) meeting inclusion criteria, of whom sepsis occurred in 2552 (7%). The ESM had a hospitalization-level area under the receiver operating characteristic curve of 0.63 (95% CI, 0.62-0.64). The ESM identified 183 of 2552 patients with sepsis (7%) who did not receive timely administration of antibiotics, highlighting the low sensitivity of the ESM in comparison with contemporary clinical practice. The ESM also did not identify 1709 patients with sepsis (67%) despite generating alerts for an ESM score of 6 or higher for 6971 of all 38 455 hospitalized patients (18%), thus creating a large burden of alert fatigue.
Conclusions and Relevance
This external validation cohort study suggests that the ESM has poor discrimination and calibration in predicting the onset of sepsis. The widespread adoption of the ESM despite its poor performance raises fundamental concerns about sepsis management on a national level. ———————— File: 2021-07-21-STAT-News-Epic-sepsis.md Creation Date: “Fri, 27 Feb 2026 19:13:30 +0000” — title: “STAT News: A popular algorithm to predict sepsis misses most cases and sends frequent false alarms, study finds” categories:
- Blog
- Research tags:
- Blog
- Press
- sepsis
- deterioration index
- Epic
- early warning system
- medicine
- healthcare
- artificial intelligence
- machine learning
-
STAT News
Casey Ross of STAT News covered our JAMA IM Epic Sepsis Model evaluation paper. Check out the article.
File: 2021-07-21-WIRED-An-Algorithm-That-Predicts-Deadly-Infections-Is-Often-Flawed.md Creation Date: “Fri, 27 Feb 2026 19:13:30 +0000” — title: “WIRED: An Algorithm That Predicts Deadly Infections Is Often Flawed” categories:
- Blog
- Research tags:
- Blog
- Press
- sepsis
- deterioration index
- Epic
- early warning system
- medicine
- healthcare
- artificial intelligence
- machine learning
-
WIRED
Tom Simonite of WIRED covered our JAMA IM Epic Sepsis Model evaluation paper. Check out the article.
File: 2021-07-22-The-Verge-A-hospital-algorithm-designed-to-predict-a-deadly-condition-misses-most-cases.md Creation Date: “Fri, 27 Feb 2026 19:13:30 +0000” — title: “The Verge: A hospital algorithm designed to predict a deadly condition misses most cases” categories:
- Blog
- Research tags:
- Blog
- Press
- sepsis
- deterioration index
- Epic
- early warning system
- medicine
- healthcare
- artificial intelligence
- machine learning
-
The Verge
Nicole Wetsman of The Verge covered our JAMA IM Epic Sepsis Model evaluation paper. Check out the article.
File: 2021-07-26-The-Washington-Post-A-hospital-algorithm-designed-to-predict-a-deadly-condition-misses-most-cases copy.md Creation Date: — title: “The Washington Post: Sepsis prediction tool used by hospitals misses many cases, study says. Firm that developed the tool disputes those findings.” categories:
- Blog
- Research tags:
- Blog
- Press
- sepsis
- deterioration index
- Epic
- early warning system
- medicine
- healthcare
- artificial intelligence
- machine learning
-
The Washington Post
Erin Blakemore of The Washington Post covered our JAMA IM Epic Sepsis Model evaluation paper. Check out the article.
File: 2021-08-01-Mind-the-Performance-Gap.md Creation Date: “Fri, 27 Feb 2026 19:13:30 +0000” — title: “Mind the Performance Gap: Dataset Shift During Prospective Validation” categories:
- Blog
- Research tags:
- Blog
- Research
- machine learning
- artificial intelligence
- healthcare
- medicine
-
electronic health record
Our 2021 Machine Learning for Healthcare Conference paper! It discusses a special kind of dataset shift that is particularly pervasive and pernicious when developing and implementing ML/AI models for use in healthcare. Here’s a link to the Mind the Performance Gap paper that I authored with Jeeheh Oh, Benjamin Li, Michelle Bochinski, Hyeon Joo, Justin Ortwine, Erica Shenoy, Laraine Washer, Vincent B. Young, Krishna Rao, and Jenna Wiens.
Abstract
Once integrated into clinical care, patient risk stratification models may perform worse com- pared to their retrospective performance. To date, it is widely accepted that performance will degrade over time due to changes in care processes and patient populations. However, the extent to which this occurs is poorly understood, in part because few researchers re- port prospective validation performance. In this study, we compare the 2020-2021 (’20-’21) prospective performance of a patient risk stratification model for predicting healthcare- associated infections to a 2019-2020 (’19-’20) retrospective validation of the same model. We define the difference in retrospective and prospective performance as the performance gap. We estimate how i) “temporal shift”, i.e., changes in clinical workflows and patient populations, and ii) “infrastructure shift”, i.e., changes in access, extraction and transfor- mation of data, both contribute to the performance gap. Applied prospectively to 26,864 hospital encounters during a twelve-month period from July 2020 to June 2021, the model achieved an area under the receiver operating characteristic curve (AUROC) of 0.767 (95% confidence interval (CI): 0.737, 0.801) and a Brier score of 0.189 (95% CI: 0.186, 0.191). Prospective performance decreased slightly compared to ’19-’20 retrospective performance, in which the model achieved an AUROC of 0.778 (95% CI: 0.744, 0.815) and a Brier score of 0.163 (95% CI: 0.161, 0.165). The resulting performance gap was primarily due to in- frastructure shift and not temporal shift. So long as we continue to develop and validate models using data stored in large research data warehouses, we must consider differences in how and when data are accessed, measure how these differences may negatively affect prospective performance, and work to mitigate those differences. ———————— File: 2021-08-01-evaluating-a-widely-implemented-proprietary-deterioration-index-among-inpatients-with-COVID.md Creation Date: “Fri, 27 Feb 2026 19:13:30 +0000” — title: “Evaluating a Widely Implemented Proprietary Deterioration Index Model among Hospitalized Patients with COVID-19” categories:
- Blog
- Research tags:
- Blog
- Research
- COVID
- deterioration index
- Epic
- early warning system
- medicine
- healthcare
- artificial intelligence
-
machine learning
Annals of the American Thoracic Society. Can be found here.
Abstract
Rationale
The Epic Deterioration Index (EDI) is a proprietary prediction model implemented in over 100 U.S. hospitals that was widely used to support medical decision-making during the coronavirus disease (COVID-19) pandemic. The EDI has not been independently evaluated, and other proprietary models have been shown to be biased against vulnerable populations.
Objectives
To independently evaluate the EDI in hospitalized patients with COVID-19 overall and in disproportionately affected subgroups.
Methods
We studied adult patients admitted with COVID-19 to units other than the intensive care unit at a large academic medical center from March 9 through May 20, 2020. We used the EDI, calculated at 15-minute intervals, to predict a composite outcome of intensive care unit–level care, mechanical ventilation, or in-hospital death. In a subset of patients hospitalized for at least 48 hours, we also evaluated the ability of the EDI to identify patients at low risk of experiencing this composite outcome during their remaining hospitalization.
Results
Among 392 COVID-19 hospitalizations meeting inclusion criteria, 103 (26%) met the composite outcome. The median age of the cohort was 64 (interquartile range, 53–75) with 168 (43%) Black patients and 169 (43%) women. The area under the receiver-operating characteristic curve of the EDI was 0.79 (95% confidence interval, 0.74–0.84). EDI predictions did not differ by race or sex. When exploring clinically relevant thresholds of the EDI, we found patients who met or exceeded an EDI of 68.8 made up 14% of the study cohort and had a 74% probability of experiencing the composite outcome during their hospitalization with a sensitivity of 39% and a median lead time of 24 hours from when this threshold was first exceeded. Among the 286 patients hospitalized for at least 48 hours who had not experienced the composite outcome, 14 (13%) never exceeded an EDI of 37.9, with a negative predictive value of 90% and a sensitivity above this threshold of 91%.
Conclusions
We found the EDI identifies small subsets of high-risk and low-risk patients with COVID-19 with good discrimination, although its clinical use as an early warning system is limited by low sensitivity. These findings highlight the importance of independent evaluation of proprietary models before widespread operational use among patients with COVID-19. ———————— File: 2021-08-05-MLHC-Presentation.md Creation Date: “Fri, 27 Feb 2026 19:13:30 +0000” — title: “Machine Learning for Healthcare Conference: Characterizing the Performance Gap” categories:
- Blog
- Talk tags:
- medicine
- healthcare
- machine learning
- artificial intelligence
-
operations research
Jeeheh Oh and I presented our work on dataset shift at the 2021 Machine Learning for Healthcare Conference. This talk briefly summarizes our our conference paper.
Abstract
Once integrated into clinical care, patient risk stratification models may perform worse com- pared to their retrospective performance. To date, it is widely accepted that performance will degrade over time due to changes in care processes and patient populations. However, the extent to which this occurs is poorly understood, in part because few researchers re- port prospective validation performance. In this study, we compare the 2020-2021 (’20-’21) prospective performance of a patient risk stratification model for predicting healthcare- associated infections to a 2019-2020 (’19-’20) retrospective validation of the same model. We define the difference in retrospective and prospective performance as the performance gap. We estimate how i) “temporal shift”, i.e., changes in clinical workflows and patient populations, and ii) “infrastructure shift”, i.e., changes in access, extraction and transfor- mation of data, both contribute to the performance gap. Applied prospectively to 26,864 hospital encounters during a twelve-month period from July 2020 to June 2021, the model achieved an area under the receiver operating characteristic curve (AUROC) of 0.767 (95% confidence interval (CI): 0.737, 0.801) and a Brier score of 0.189 (95% CI: 0.186, 0.191). Prospective performance decreased slightly compared to ’19-’20 retrospective performance, in which the model achieved an AUROC of 0.778 (95% CI: 0.744, 0.815) and a Brier score of 0.163 (95% CI: 0.161, 0.165). The resulting performance gap was primarily due to in- frastructure shift and not temporal shift. So long as we continue to develop and validate models using data stored in large research data warehouses, we must consider differences in how and when data are accessed, measure how these differences may negatively affect prospective performance, and work to mitigate those differences. ———————— File: 2021-10-11-CHEPS-Seminar.md Creation Date: “Fri, 27 Feb 2026 19:13:30 +0000” — title: “CHEPS Seminar: Engineering Machine Learning for Medicine” categories:
- Blog
- Talk tags:
- medicine
- healthcare
- machine learning
- artificial intelligence
- operations research
- industrial engineering
-
health system engineering
Invited to give a talk for the 2021 University of Michigan Center for Healthcare Engineering and Patient Safety (CHEPS) fall seminar series. Discussed engineering machine learning for medicine. Gave an overview of the whole healthcare AI/ML lifecycle and discussed it is chockablock with cool industrial & health systems engineering problems.
File: 2021-10-31-Using-NLP-to-Automatically-Assess-Feedback-Quality.md Creation Date: “Fri, 27 Feb 2026 19:13:30 +0000” — title: “Using Natural Language Processing to Automatically Assess Feedback Quality: Findings From 3 Surgical Residencies” categories:
- Blog
- Research tags:
- Blog
- Research
- medicine
- healthcare
- artificial intelligence
- machine learning
- natural language processing
- medical education
-
SIMPL
Academic Medicine. Can be found here.
Abstract
Purpose
Learning is markedly improved with high-quality feedback, yet assuring the quality of feedback is difficult to achieve at scale. Natural language processing (NLP) algorithms may be useful in this context as they can automatically classify large volumes of narrative data. However, it is unknown if NLP models can accurately evaluate surgical trainee feedback. This study evaluated which NLP techniques best classify the quality of surgical trainee formative feedback recorded as part of a workplace assessment.
Method
During the 2016–2017 academic year, the SIMPL (Society for Improving Medical Professional Learning) app was used to record operative performance narrative feedback for residents at 3 university-based general surgery residency training programs. Feedback comments were collected for a sample of residents representing all 5 postgraduate year levels and coded for quality. In May 2019, the coded comments were then used to train NLP models to automatically classify the quality of feedback across 4 categories (effective, mediocre, ineffective, or other). Models included support vector machines (SVM), logistic regression, gradient boosted trees, naive Bayes, and random forests. The primary outcome was mean classification accuracy.
Results
The authors manually coded the quality of 600 recorded feedback comments. Those data were used to train NLP models to automatically classify the quality of feedback across 4 categories. The NLP model using an SVM algorithm yielded a maximum mean accuracy of 0.64 (standard deviation, 0.01). When the classification task was modified to distinguish only high-quality vs low-quality feedback, maximum mean accuracy was 0.83, again with SVM.
Conclusions
To the authors’ knowledge, this is the first study to examine the use of NLP for classifying feedback quality. SVM NLP models demonstrated the ability to automatically classify the quality of surgical trainee evaluations. Larger training datasets would likely further increase accuracy. ———————— File: 2021-11-01-INFORMS-Dynamic-Machine-Learning.md Creation Date: “Fri, 27 Feb 2026 19:13:30 +0000” — title: “INFORMS: Dynamic Machine Learning for Medical Practice” categories:
- Blog
- Talk tags:
- medicine
- healthcare
- machine learning
- artificial intelligence
- operations research
- industrial engineering
-
health system engineering
INFORMS conference talk focused on dynamic machine learning for medicine. Based on Joint work with Jon Seymour, MD (Peers Health) and Brian Denton PhD (University of Michigan).
Time is a crucial factor of clinical practice. Our work explores the intersection of time and machine learning (ML) in the context of medicine. This presentation will examine the creation, validation, and deployment of dynamic ML models. We discuss dynamic prediction of future work status for patients who have experienced occupational injuries. Methodologically we cover a framework for dynamic prediction health-state prediction that combines a novel data transformation with an appropriate automatically generated deep learning architecture. These projects expand our understanding of how to effectively train and utilize dynamic machine learning models in the service of advancing health.
File: 2021-11-02-Trust-The-AI-You-Decide.md Creation Date: “Fri, 27 Feb 2026 19:13:30 +0000” — title: “Forbes: Trust The AI? You Decide” categories:
- Blog
- Research tags:
- Blog
- Press
- sepsis
- deterioration index
- Epic
- early warning system
- medicine
- healthcare
- artificial intelligence
- machine learning
-
Forbes
Arun Shashtri of Forbes covered our JAMA IM Epic Sepsis Model evaluation paper. Check out the article.
File: 2021-11-19-Quantification-of-Sepsis-Model-Alerts-in-24-US-Hospitals-Before-and-During-the-COVID-19-Pandemic.md Creation Date: “Fri, 27 Feb 2026 19:13:30 +0000” — title: “Quantification of Sepsis Model Alerts in 24 US Hospitals Before and During the COVID-19 Pandemic” categories:
- Blog
- Research tags:
- Blog
- Research
- sepsis
- deterioration index
- Epic
- early warning system
- medicine
- healthcare
- artificial intelligence
-
machine learning
JAMA Network Open. Can be found here.
Download paper.
File: 2021-12-02-NLP-and-Assessment-of-Resident-Feedback-Quality.md Creation Date: “Fri, 27 Feb 2026 19:13:30 +0000” — title: “Natural Language Processing and Assessment of Resident Feedback Quality” categories:
- Blog
- Research tags:
- Blog
- Research
- medicine
- healthcare
- artificial intelligence
- machine learning
- natural language processing
- medical education
-
SIMPL
Journal of Surgical Education. Can be found here.
Abstract
Objective
To validate the performance of a natural language processing (NLP) model in characterizing the quality of feedback provided to surgical trainees.
Design
Narrative surgical resident feedback transcripts were collected from a large academic institution and classified for quality by trained coders. 75% of classified transcripts were used to train a logistic regression NLP model and 25% were used for testing the model. The NLP model was trained by uploading classified transcripts and tested using unclassified transcripts. The model then classified those transcripts into dichotomized high- and low- quality ratings. Model performance was primarily assessed in terms of accuracy and secondary performance measures including sensitivity, specificity, and area under the receiver operating characteristic curve (AUROC).
Setting
A surgical residency program based in a large academic medical center.
Participants
All surgical residents who received feedback via the Society for Improving Medical Professional Learning smartphone application (SIMPL, Boston, MA) in August 2019.
Results
The model classified the quality (high vs. low) of 2,416 narrative feedback transcripts with an accuracy of 0.83 (95% confidence interval: 0.80, 0.86), sensitivity of 0.37 (0.33, 0.45), specificity of 0.97 (0.96, 0.98), and an area under the receiver operating characteristic curve of 0.86 (0.83, 0.87).
Conclusions
The NLP model classified the quality of operative performance feedback with high accuracy and specificity. NLP offers residency programs the opportunity to efficiently measure feedback quality. This information can be used for feedback improvement efforts and ultimately, the education of surgical trainees. ———————— File: 2021-12-02-NLP-to-Estimate-Clinical-Competency-Committee-Ratings.md Creation Date: “Fri, 27 Feb 2026 19:13:30 +0000” — title: “Natural Language Processing to Estimate Clinical Competency Committee Ratings” categories:
- Blog
- Research tags:
- Blog
- Research
- medicine
- healthcare
- artificial intelligence
- machine learning
- natural language processing
- medical education
-
SIMPL
Journal of Surgical Education. Can be found here.
Abstract
Objective
Residency program faculty participate in clinical competency committee (CCC) meetings, which are designed to evaluate residents’ performance and aid in the development of individualized learning plans. In preparation for the CCC meetings, faculty members synthesize performance information from a variety of sources. Natural language processing (NLP), a form of artificial intelligence, might facilitate these complex holistic reviews. However, there is little research involving the application of this technology to resident performance assessments. With this study, we examine whether NLP can be used to estimate CCC ratings.
Design
We analyzed end-of-rotation assessments and CCC assessments for all surgical residents who trained at one institution between 2014 and 2018. We created models of end-of-rotation assessment ratings and text to predict dichotomized CCC assessment ratings for 16 Accreditation Council for Graduate Medical Education (ACGME) Milestones. We compared the performance of models with and without predictors derived from NLP of end-of-rotation assessment text.
Results
We analyzed 594 end-of-rotation assessments and 97 CCC assessments for 24 general surgery residents. The mean (standard deviation) for area under the receiver operating characteristic curve (AUC) was 0.84 (0.05) for models with only non-NLP predictors, 0.83 (0.06) for models with only NLP predictors, and 0.87 (0.05) for models with both NLP and non-NLP predictors.
Conclusions
NLP can identify language correlated with specific ACGME Milestone ratings. In preparation for CCC meetings, faculty could use information automatically extracted from text to focus attention on residents who might benefit from additional support and guide the development of educational interventions. ———————— File: 2021-12-04-Comparative-Assessment-of-a-Machine-Learning-Model-and-Rectal-Swab-Surveillance-to-Predict-Hospital-Onset-Clostridioides-difficile.md Creation Date: “Fri, 27 Feb 2026 19:13:30 +0000” — title: “Comparative Assessment of a Machine Learning Model and Rectal Swab Surveillance to Predict Hospital Onset Clostridioides difficile” categories:
- Blog
- Research tags:
- Blog
- Research
- Clostridioides difficile
- infectious disease
- early warning system
- medicine
- healthcare
- artificial intelligence
-
machine learning
IDWeek Abstract. Can be found here.
Download paper.
File: 2021-12-07-IOE-Research-Spotlight.md Creation Date: “Fri, 27 Feb 2026 19:13:30 +0000” — title: “IOE Research Spotlight” categories:
- Blog
- Talk tags:
- medicine
- healthcare
- machine learning
- artificial intelligence
- operations research
- industrial engineering
-
health system engineering
Shared an overview of my research during the 2021 University of Michigan Department of Industrial and Operations Engineering recruiting weekend.
File: 2021-12-09-Precision-Health-Webinar.md Creation Date: “Fri, 27 Feb 2026 19:13:30 +0000” — title: “Precision Health Webinar: What Clinicians Need to Know when Using AI” categories:
- Blog
- Talk tags:
- medicine
- machine learning
-
artificial intelligence
Panel discussion on what is important for clinicians to know and how confident they can be when using these AI tools. Conversation with Drs. Rada Mihalcea, Max Spadafore, and Cornelius James.
File: 2022-01-07-hello-world.md Creation Date: “Fri, 27 Feb 2026 19:13:30 +0000” — title: “Hello, World!” categories:
- Blog tags:
-
Blog
Hello, World!
Welcome to Ötleş Notes! It’s a blog by me (Erkin Ötleş).
For a little background: I am a Medical Scientist Training Program Fellow at the University of Michigan. What does that mean in English? It means I am a very silly person who decided to go to school forever in order to study medicine (MD) and engineering (PhD in industrial and operations engineering). Generally, I am fascinated by the intersection of engineering and medicine. I strongly believe that both fields have a lot to learn from one another. While working between the two presents challenges, I am genuinely grateful to learn from wonderful mentors and colleagues in both fields.
As I come across interesting topics that pertain to medicine or engineering I’ll try to share them here along with my perspective. I won’t make any guarantees regarding posting frequency or topics. However, I will to make every effort to cite original sources and be as factual as possible.
Ultimately this is a project for myself: 1) to help strengthen my written communication skills and 2) allow me to explore a broader space of ideas. If you happen to get something out of it too in the meantime that’s a wonderful byproduct.
If you have ideas about my ideas feel free to reach out to me on twitter (@eotles) or write me an email.
Cheers,
Erkin
Go ÖN Home
————————
File: 2022-01-10-solving-wordle.md
Creation Date: “Fri, 27 Feb 2026 19:13:30 +0000”
—
title: “Solving Wordle”
categories:
- Blog tags:
- wordle
- decision science
- operations research
- optimization
- games
- artificial intelligence
-
machine learning
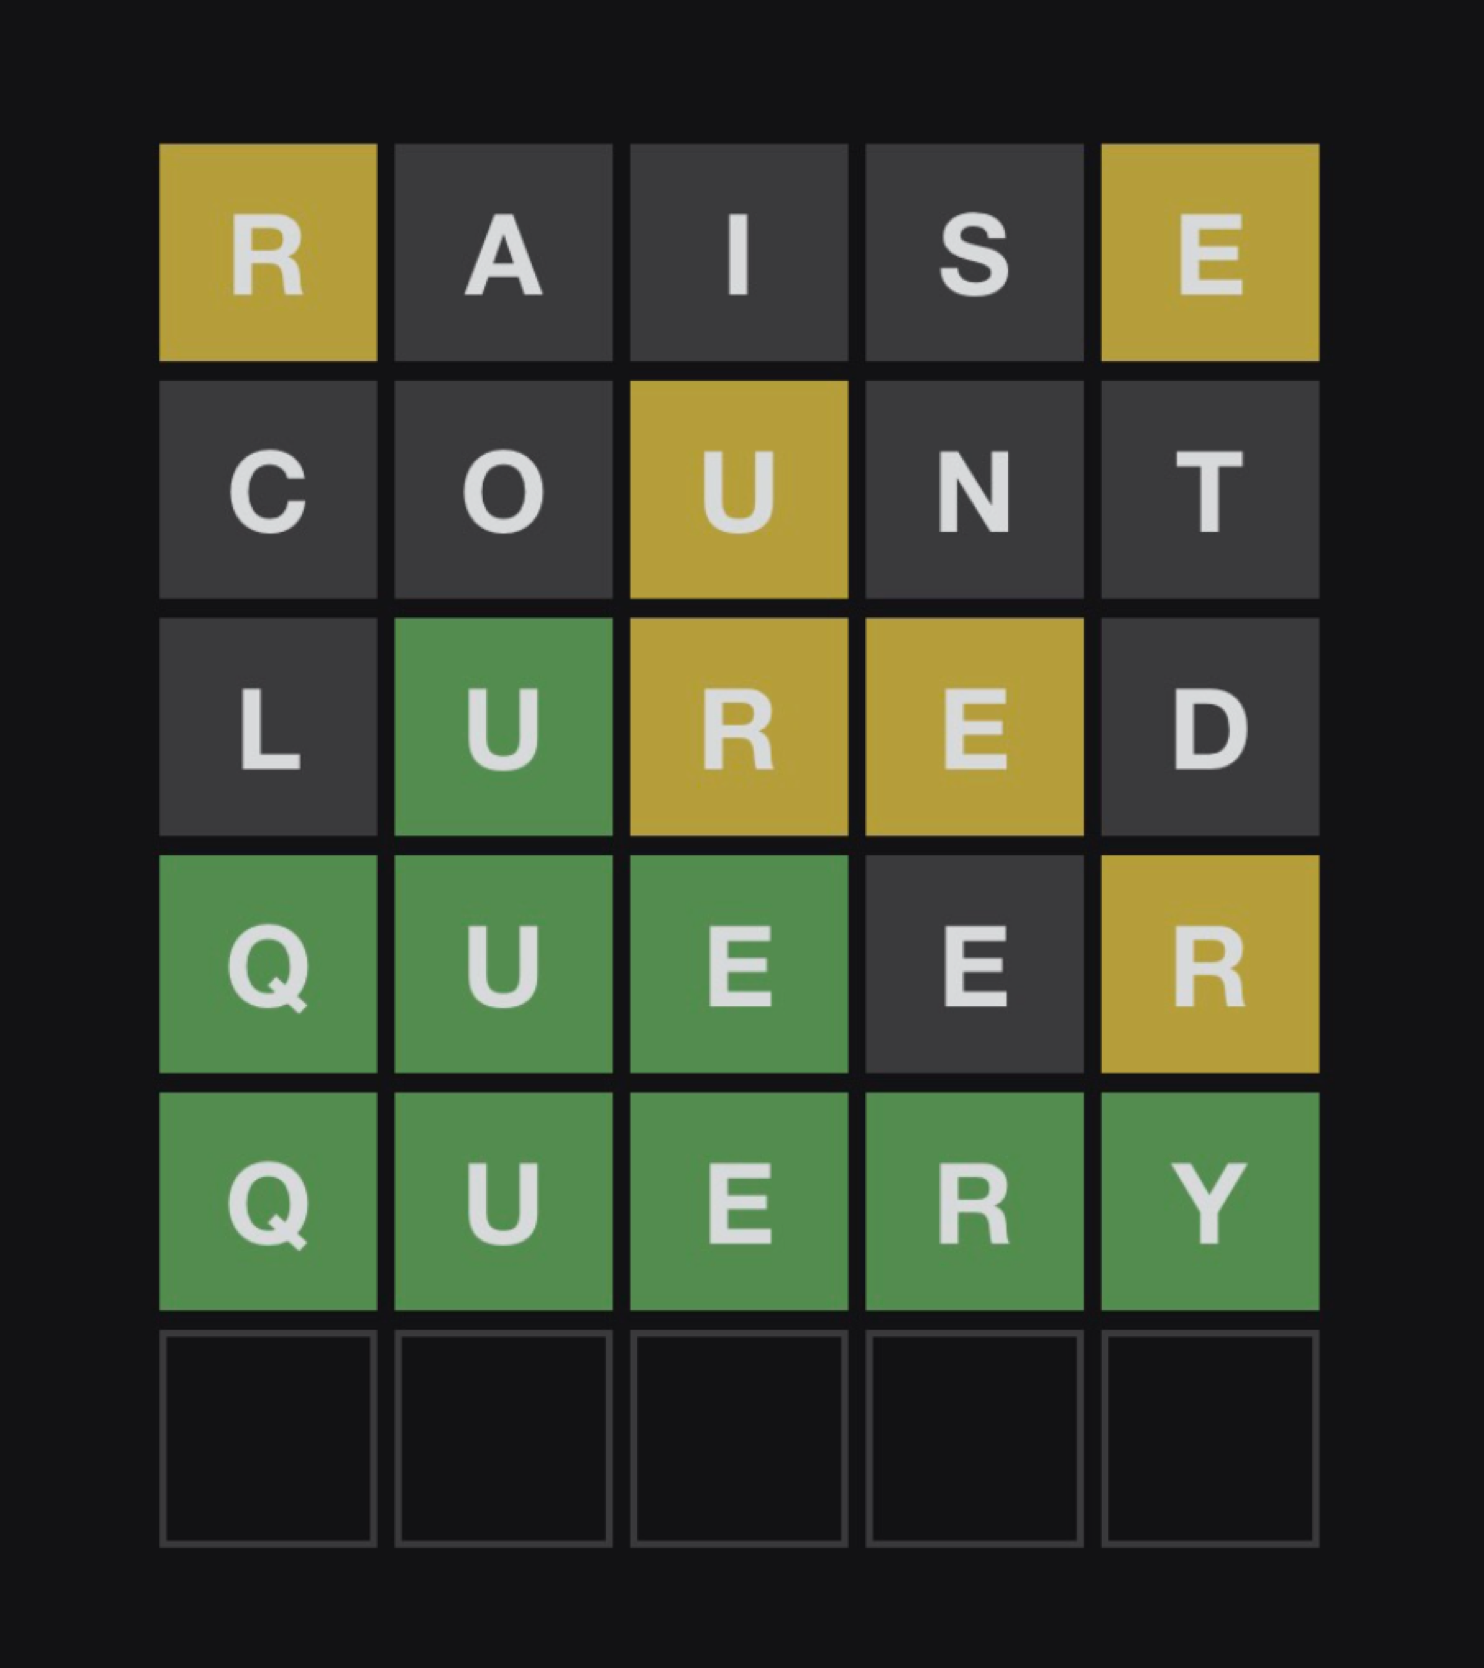
Let’s talk about Wordle. [1] You, like me, might have been drawn into this game recently, courtesy of those yellow and green squares on twitter. The rules are simple, you get 6 attempts to guess the 5 letter word. After every attempt you get feedback in the form of the colored squares around your letters. Grey means this character isn’t used at all. Yellow means that the character is used, but in a different position. Finally, green means you nailed the character to (one of) the right position(s). Here’s an example of a played game:
A valiant wordle attempt by J.B. Cheadle (January 10th 2022)
It’s pretty fun to play, although wracking your brain for 5 letter words can be annoying, especially since you are not allowed to guess words that aren’t real words (e.g., you can’t use AEIOU). Once I got the hang of the game’s mechanics my natural inclination was to not enjoy the once daily word guessing diversion, but was to find a way to “solve wordle”.
Now, what does it mean to “solve wordle”? Maybe you would like to start with a really good guess? Maybe you would like to guarantee that you win the game (i.e., guess the right word by your sixth try)? Or perhaps, you’d like to win the game and get the most amount of greens or yellow on the way? “Solving” is a subjective and probably depends on your preferences.
Due to this subjectivity I think there’s couple valid ways to tackle wordle. If you have a strong preference for one type of solution you might be able to express that directly and then solve the game in order to get the optimal way to play. I’m going to try to avoid the O-word because: 1) I don’t know what you’d like to optimize for and 2) these approaches below don’t solve for the true optimal solution (they are heuristics).
The solution strategies I’ve explored thus far can be broken down into two major categories. The first set of strategies are trying to find really good first words to start with (First Word) and the second set are finding strategies that can be used to pick good words throughout the course of the game in response to responses received from guesses (Gameplay).
Let’s start with the First Words strategies: there are two first word strategies that can be employed based on how you’d like to start your game. First Word - Common Characters: ideal if you’d like to start your game using words that have the most common characters with all the solution words. Think of this as trying to maximize the number of yellow characters that you get on the first try.
-
First Word - Right Character in Right Position: ideal if you’d like to start the game using words that have the highest likelihood of having the right characters in the right position. This would yield the most number of green characters.
Rank Solution Words Usable Words 1st later, alter, alert oater, orate, roate 2nd sonic, scion lysin 2nd pudgy chump :) -
First Word - Right Character in Right Position: ideal if you’d like to start the game using words that have the highest likelihood of having the right characters in the right position. This would yield the most number of green characters.
Rank Solution (& Usable) Words 1st slate 2nd crony 2nd build
Note on solution word vs. usable words. Wordle has two sets of words, solution words and other words. Other words are never the correct answer but can be used as a guess. There’s a chance that other words can be used to get a lot of yellows, despite never being the correct answer. So I created a list of usable words that combined the solution words and the other words. Notice that the First Word - Common Characters strategy has two lists. That’s because there are other words like “oater” that are more likely to produce yellows than the best solution word “later”. This isn’t the case for the First Word - Right Character in Right Position, as it produces the same results for both sets of words.
You might also observe that there are several sets of words in terms of 1st, 2nd, and 3rd. If you wanted you could use these strategies over several rounds to build up your knowledge. However, these strategies don’t take into account the feedback that you get from the game. So there may be better ways to play the game that take into account what kind of results you get after you put in a guess.
These strategies are the Gameplay strategies. I’ll present two potential approaches that use knowledge as it is collected.
- Gameplay - Refine List + Common Characters: this one works by sifting through the remaining words that are feasible (e.g., don’t use grey characters and have green characters in the right spot) and then uses the Common Characters approach to rank the potential word choices that remain.
- Gameplay - Reinforcement Learning: this one works by learning what is the best word to guess given what you have guessed in the past. [2] It does this learning by playing the Wordle many times (e.g., millions) and then collecting a reward based on how it does (+1 point for winning and 0 points for losing). Over repeated plays of the game we can learn what guesses might lead to winning based on the current state of the game.
Here is an example of the Gameplay - Refine List + Common Characters strategy in action based on the Wordle from January 10th 2022.
| Guess # | Green Characters | Grey Characters | Guess | Result |
|---|---|---|---|---|
| 1 | ***** | alert |  |
|
| 2 | **\er* | a, l, t | fiery |  |
| 3 | **\ery* | a, f, i, l, t | query |  |
Here you can see that after every guess we get to update the green characters and the grey characters that we know about. For example after round 1, we know that the word must be **er* (where * represent wildcards) and must not contain the characters: a, l (el) or t. I use regular expressions to search through the list of words, the search expression is really simple, it just replaces * in the green character string with tokens for the remaining viable characters (the set of alphabet characters minus the grey characters).
The reinforcement learning based approach would operate in a similar manner for a user. However, the mechanics under the hood are a bit more complicated. If you are interested in how it (or any of the other strategies) work please see the appendix.
As I mentioned above, solving wordle is subjective. You might not like my approaches or might think there are ways for them to be improved. Luckily I’m not the only one thinking about this problem. [3, 4]
Erkin
Go ÖN Home
Appendix
This contains some technical descriptions of the approaches described above.
First Word - Common Characters
This one is pretty simple. I am essentially trying to find the word that has the most unique characters in common with other words (this is a yellow match).
In order to do this I reduce words down to character strings which are just lists of unique characters that the words are made up of. So for an example, the word “savvy” becomes the string list: a,s,v,y. We then use the chapter strings to count the number of words represented by a character. So using the character string from above the characters a, s, v, and y would all have their counts incremented by 1. These counts represent the number of words covered by a character (word coverage).
We then search through all words and calculate their total word coverage. This is done by summing up the counts for every character in the word. We then select the word with the highest amount of other word coverage. In order to find words to be used in subsequent rounds we can remove the characters already covered by previously selected words and repeats the previous step.
Code can be found in the first_word_common_characters.ipynb notebook.
First Word - Right Character in Right Position
This one is a pretty straightforward extension of the First Word - Common Characters approach that has an added constraint, which is position must be tracked along with the characters.
To do this we count a character-position tuples. For every word we loop through the characters and their positions. We keep track of the number of times a character-position is observed. For example, the world “savvy” would increment the counts for the following character-portion tuples: (s, 1), (a, 2), (v, 3), (v, 4), (y, 5). These counts represent the number of words covered by a character-tuple (word coverage).
We then loop through every word and calculate their total word coverage. This is done by breaking the word into character-position tuples and summing up the counts of the observed character-positions.
Code can be found in the first_word_right_character_in_right_position.ipynb notebook.
Both the First Word strategies can be converted from counts to probabilities. I haven’t done this yet, but maybe I’ll update this post in the future to have that information.
The Gameplay strategies are a little more complicated than the First Word strategies because they need to be able to incorporate the state of the game into the suggestion for the next move.
Gameplay - Refine List + Common Characters
This approach is reminds me of an AI TA I had. He would always say “AI is just search”. Which is true. This approach is pretty much searching over the word list with some filtering and using some distributional knowledge. It was surprised at how easily it came together and how effective it is. As a side note, it was probably the easiest application of regex that I’ve had in a while.
There are three components to this approach:
- Generate Regex: build the search filter
- Get possible solutions: apply filter to the word list
- Rank order solutions: apply common character counting on the filtered word list
I will briefly detail some of the intricacies of these components.
Generate Regex: the users need to provide 3 things before a guess 1) a string with the green characters positioned correctly and wildcards (*) elsewhere, 2) a list of the yellow characters found thus far, and finally 3) a list of the gray characters. Using this information we build a regular expression that describes the structure of the word we are looking for. For example let’s say we had **ery as green letters and every character other than q and u were greyed out then we would have a regex search pattern as follows: [qu][qu]ery.
Get possible solutions: after building the regex search string we can loop through the list of solution words and filter all the words that don’t meet the regex search pattern. We can additionally remove any words that do not use characters from the yellow characters list. Finally, we then Rank Order Solutions by finding each words coverage using the approach described in Common Characters above. This produces a list of words ranked by their likelihood of producing yellow characters on the remaining possible words.
Code can be found in the gameplay_refine_list_common_characters.ipynb notebook. There’s also a blogpost with this solver implemented.
There’s also a website with this solver implemented.
Gameplay - Reinforcement Learning
This approach is based on tabular Q-learning. [2, 5] Its a little bit complicated and I’m unsure the training procedure produced ideal results. But I’ll provide a brief overview.
Reinforcement learning seeks to learn the right action to take in a given state. [6] You can use it to learn how to play games if you can formulate that game as a series of states (e.g., representing a board position) and actions (potential moves to take). [5] In order to convert tackle the wordle task with RL we need a way to represent the guesses that we’ve already done (state) and the next guess we should make (action).
The actions are pretty obvious, have one action for each potential solution word we can guess. There’s about 2,000 of these.
The states are where things get hairy. If you wanted to encode all the information that the keyboard contains you would need at least 4^26 states. This is because there are 4 states a character can take {black/un-guessed, yellow, green, grey} each character can be in anyone of these states. This is problematic - way too big! Additionally, this doesn’t encode the guesses we have tied. What I eventually settled on was a state representation that combined the last guessed word along with the results (the colors) for each character. This is a much more manageable 2,000 x 4^5.
I then coded up the wordle game and used tabular Q-learning to learn the value of state action pairs. This was done through rewarding games that resulted in a win with a 1 and losses getting a 0.
I think this also might be solvable using dynamic programming as we know the winning states. These are terminal and then I think you can work backwards to assign values to the intermediary states. It’s been almost a decade since I took my dynamic programming class, so I need a bit of a refresher before I dive into it.
As you can see, there are a lot of interesting questions that arise from formulating this task as an RL problem. I will probably come back to this and explore it further in the future.
Bibliography
- Wordle - A daily word game. 2022; Available from: https://www.powerlanguage.co.uk/wordle/.
- Q-Learning - An introduction through a simple table based implementation with learning rate, discount factor and exploration - gotensor. 2019.
- Solve Wordle. 2022; Available from: https://www.solvewordle.com/.
- Glaiel, T., The mathematically optimal first guess in Wordle. 2022.
- Friedrich, C., Part 3 - Tabular Q Learning, a Tic Tac Toe player that gets better and better. 2018.
-
Sutton, R.S. and A.G. Barto, Reinforcement learning : an introduction. Adaptive computation and machine learning. 1998, Cambridge, Mass.: MIT Press. xviii, 322 p.
File: 2022-01-10-wordle-solver.md Creation Date: “Fri, 27 Feb 2026 19:13:30 +0000” — title: “Wordle Solver” categories:
- Blog tags:
-
Blog
<!DOCTYPE html>
The pointer starts out as a normal arrow pointer then changes to a horizontal I beam pointer once the Word application is brought into focus by clicking. As the pointer travels left the pointer switches to a flipped arrow pointer. Traveling to the right we see the horizontal I beam pointer and eventually the normally expected classic arrow pointer. What the #$@!%? It took me a while to figure this out, because googling “flipped reversed pointer cursor” primarily gives you stuff pertaining to mouse scrolling direction. But I eventually happened across a helpful StackExchange discussion. [2] Apparently, this is meant to be a useful feature for users. If you click when the pointer is in the flipped configuration Word will highlight the corresponding line of text, see example video below:
Once you know about this you might consider it helpful. But really?! It is a buried feature that leads to two outcomes: 1) it doesn’t get noticed by the majority of users or 2) when it does get noticed it causes confusion (🙋🏾♂️). Apparently, other MS Office applications do similar things when the pointer goes leftward. [2] However, the Microsoft pointer UI documentation has no mention of why or when a flipped arrow pointer is supposed to be employed. [3] Maybe I’m totally off-base. Maybe the flipped arrow pointer in MS Office applications leads to features that are loved by the masses. Maybe I have just missed this particular train? Probably not. I have a tendency to agree with the JohnGB on StackExchange that: “Consistency matters in UX, even when it is in things that most people will not be able to consciously notice.” I think this is a good parting thought, it is especially salient for those of us that work in healthcare IT. The mental workload in healthcare is taxing, so software user experiences should be as simple as possible. There’s no reason to confuse your users by adding complexity and breaking your own design rules, especially if you aren’t providing substantial value. Erkin
[Go ÖN Home](../../index.md)
Note: the discrepancy in verbiage between the title and the text. Mouse cursor and pointer seem to be interchangeable when referring to the “pointy thing”. [4] I use pointer through the text as that’s what Apple’s human interface guidelines call it. [1] But the codebase refers to NSCursor, so 🤷🏾♂️. Note 2: below are the versions of the software I was using. MacOS: 12.0.1 (21A559) Word 16.56 (21121100) Pages: 11.2 (7032.0.145) Note 3: it is annoying that you can’t copy the version number from the About Word window of Microsoft Word. ## Bibliography 1. Apple. Human Interface Guidelines: Mouse and Trackpad. 2022; Available from: https://developer.apple.com/design/human-interface-guidelines/macos/user-interaction/mouse-and-trackpad/. 2. @StackUX. When to use reversed/mirror arrow cursor? 2022; Available from: https://ux.stackexchange.com/questions/35435/when-to-use-reversed-mirror-arrow-cursor. 3. hickeys. Mouse and Pointers - Win32 apps. 2022; Available from: https://docs.microsoft.com/en-us/windows/win32/uxguide/inter-mouse. 4. Cursor (user interface) - Wikipedia. 2022; Available from: https://en.wikipedia.org/wiki/Cursor_(user_interface). ------------------------ File: 2022-01-17-plutonium-pacemakers.md Creation Date: "Fri, 27 Feb 2026 19:13:30 +0000" --- title: "Plutonium Pacemakers" categories: - Blog tags: - medicine - heart - cardiac pacemaker - nuclear power - pacemaker - engineering - biomedical devices --- This is a reformatted version of a [twitter thread I had put together nearly a year ago](https://twitter.com/eotles/status/1370206446881701891?s=20). In a former life I worked on designing the manufacturing system for cardiac pacemakers. I had done a bit of research on pacemakers at the time, but I had never come across the fact that some early pacemakers were designed and built with plutonium power sources. Begin reformatted thread: Fell down a history hole and came across the fact that we used to implant plutonium (!) powered cardiac pacemakers ❤️⚡️☢️  Below is a cutaway schematic - they used the heat generated from radioactive decay to generate electricity using thermocouples [1]  Why nuclear power? In the early days if you wanted to pace a patient for a long time (i.e. a pediatric patient) you would need to replace the pacing device a lot because the batteries would die 🔋😧 [2] 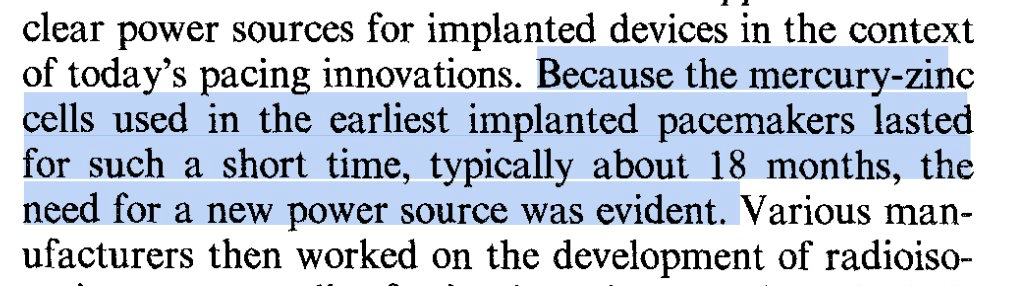 In order to sell these in the US you needed sign-off from both @US_FDA and the @NRCgov (nuclear regulatory commission). of course @Medtronic made one, but apparently a bunch other folks got in the game as well - including monsanto! [3]  As weird as it sounds people were 𝕚𝕟𝕥𝕠 the concept of having plutonium powered pacemakers at the time. [2] 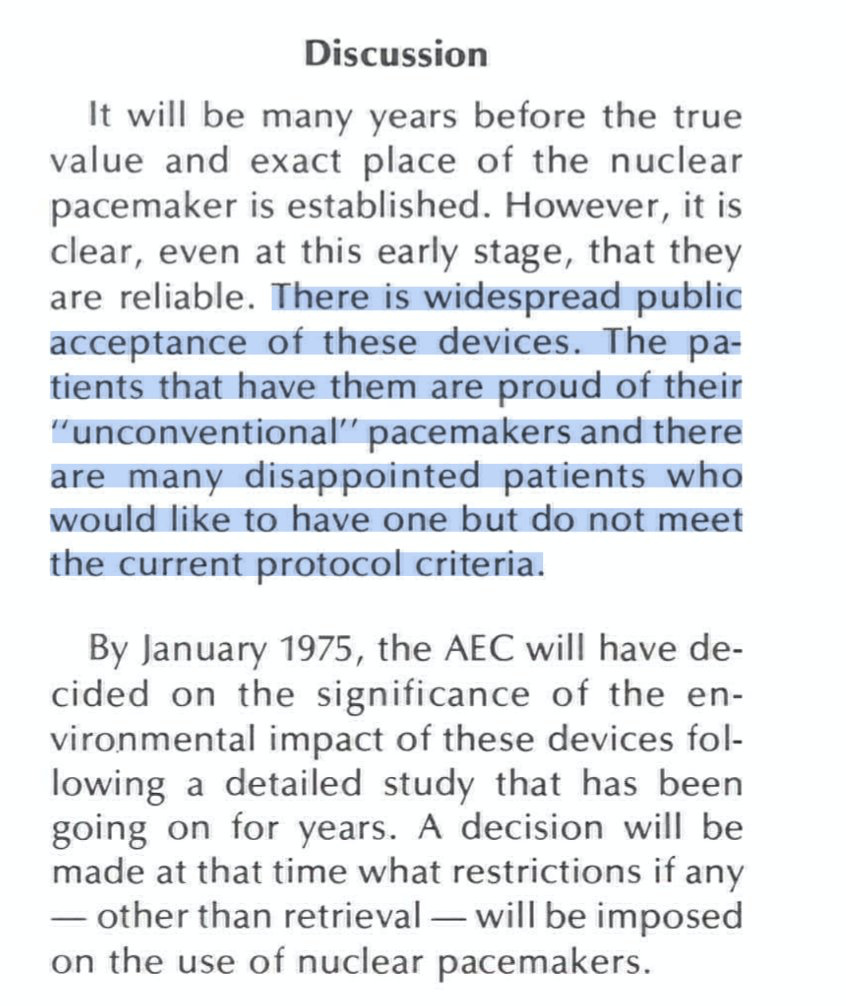 Radiation exposure was a concern, although theoretically the devices were well shielded and risk would be minimal. theory was borne out in practice - after years of study it turned out that patients with these pacemakers did NOT have higher rates of cancer. [4] 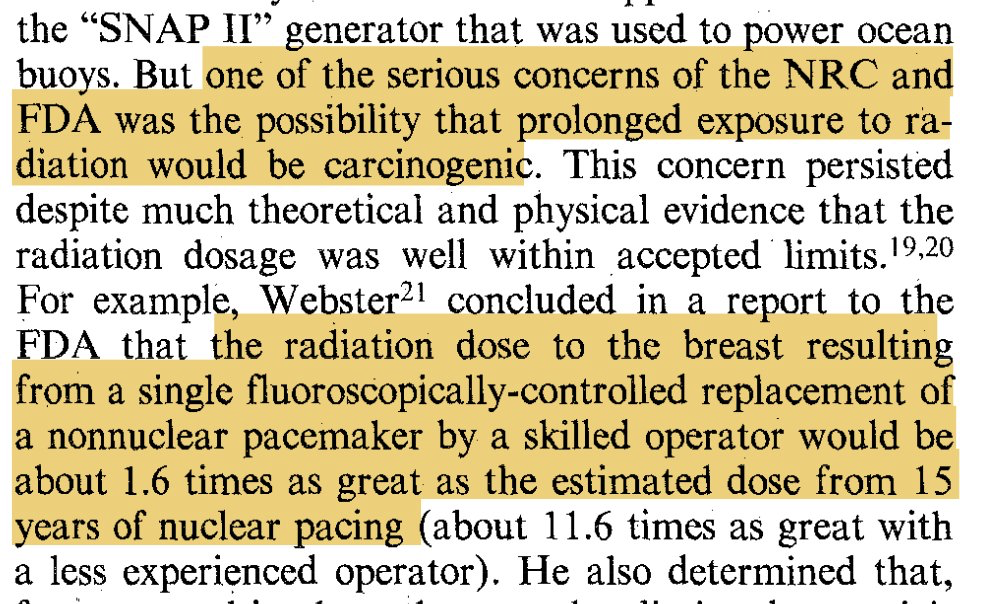 Thousands of these pacemakers were implanted in the 70s and it turns out that they lasted for a very long time. in 2007 a case report was written about a pacemaker that was still firing since its implantation in 1973! 😧 [5] This crazy longevity wasn't necessarily a great thing - replacements = better features (i.e. interrogation and programming). plus end-of-life disposal issues made plutonium pacemakers a poor choice once better batteries came along. On one hand the logic behind why you would design and implant these pacemakers makes total sense and on the other its totally wild because of the current stigma associated with everything nuclear. Erkin
[Go ÖN Home](../../index.md) ## Bibliography 1. Radioisotope thermoelectric generator - Wikipedia. 2022; Available from: https://en.wikipedia.org/wiki/Radioisotope_thermoelectric_generator. 2. Smyth, N.P., T. Hernandez, and A. Johnson, Clinical experience with radioisotopic powered cardiac pacemakers. Henry Ford Hospital Medical Journal, 1974. 22(3): p. 113-116. 3. Wayback Machine - Cardiac Pacemaker. 2022; Available from: https://web.archive.org/web/20160816084535/https://dl.dropboxusercontent.com/u/77675434/Heat%20Source%20Datasheets/CARDIAC%20PACEMAKER.pdf. 4. Parsonnet, V., A.D. Berstein, and G.Y. Perry, The nuclear pacemaker: Is renewed interest warranted? The American Journal of Cardiology, 1990. 66(10): p. 837-842. 5. Parsonnet, V., A lifetime pacemaker revisited. New England Journal of Medicine, 2007. 357(25): p. 2638-2639. ------------------------ File: 2022-01-24-looking-for-data.md Creation Date: "Fri, 27 Feb 2026 19:13:30 +0000" --- title: "Looking for Data" categories: - Blog tags: - healthcare - medicine - data - data science - machine learning - operations research - nurse call light system --- One of the nice things about being an MD-PhD student at a research institution with a large academic medical center is that you tend to have a lot of support when it comes to working on your biomedical research questions. Despite institutional support, data can be a challenge and finding the right data for your question depends a lot on your connections with the myriad various data systems and data-gate-keepers that exist in your academic environment. Having done this data sleuthing for a decade plus I have bit of experience in ferreting out interesting sources of healthcare data. One of my favorite data finds of all time was from a project I led when I was just starting out as quality improvement engineering for a hospital. I had been tasked with redesigning the inpatient rooms of the academic medical center I was working for. A significant portion of the project was blue-sky/brainstorming type engineering. But there was a portion of the project that involved troubleshooting the layout of an existing unit that had been receiving lots of complaints from nurses and CRNAs. In order to benchmark the current unit and to help inform planned changes we needed to understand the flow of work done by the nursing staff. Our typical approach for this type of data collection was to collect spaghetti diagrams. A spaghetti diagram is a simple, but effective, chart that maps the travel path of a person or an object over a given duration. [1] When complete the travel path looks like a plate of spaghetti has been spilled on a floor plan. Making spaghetti diagrams is a time consuming process, as you need an observer to track the target person (in our case nurses or CRNAs) for long periods of time. After drawing the short-straw I found myself on the night shift shadowing the superb night team of the unit.  Halfway through my night shift I started wondering if there was a better way to be collecting this information. What we really were after was how often do the nurses need to leave a patient’s room because they are missing supplies and how long does this take them? Was there another way to collect this data without having to sacrifice sleep and (more importantly) not bothering nurses and patients? I noticed that every time the nurse I shadowed entered a patient’s room there was a light above the patient’s room that lit up. When they left the room the light went dark. I inquired about the lights and learned from the nurse that I was shadowing that they were part of the nurse call light system, which is a like a souped up airplane flight attendant call light system. [2] In addition to indicating if a patient had a request it had the capability to show the presence of a nurse in a room. Additionally, I learned that this system was all wired up such that the unit coordinator (front desk of the unit) was the person that received the patient request calls and they also had a light board representing the status of the whole unit so that they could coordinate requests with nursing staff. So, what initially seemed like a simple light switch turned out to be fairly complicated system. I figured that there must be a computer system facilitating this complexity. And if there was a computer involved in exchanging data then there was a chance it might also be storing data. And if I could get access to this data I might be able to answer my unit redesign questions without having to pull too many more night shifts. And I might be able to avoid bothering nurses and patients. After leaving my shift with a stack of scribbles I emailed my supervisor inquiring about the call light system. She did a bit of hunting and found the people responsible for the call light system. After meeting with them we found out that the system did store data and that we could use it for our project, if we agreed to certain (very reasonable) terms of use. We got the data. It was in the form of logs recording every timestamp a staff ID badge entered a different room. I whipped up a java program to analyze the amount of time nursing staff were in a patient’s room and the number of times they had to bounce between patient rooms and the supply rooms. It turns out the unit we were studying did have a problem with staff needing to leave the room frequently and rooms in that unit were slotted to be remodeled with more storage. My big takeaway from this experience is that there’s alway a chance that there’s a good dataset that exists, but you won’t get access to it if you don’t do the work to look for it. And sometimes doing that work is easier than doing the work to collect your own data. :) Erkin
[Go ÖN Home](../../index.md) P.S. I started this post with some notes on gaining access to the typical datastore in academic medical settings. I have some additional thought about these data systems (e.g., discussing how they are typically structured and some of the things to look out for when using them) if you’re interested let me know and I’ll prioritize writing that up for a future post. ## Acknowledgements I’d like to thank [Zoey Chopra](https://www.linkedin.com/in/zoeychopra/) for catching a redundant paragraph. ## Bibliography 1. What is a Spaghetti Diagram, Chart or Map? | ASQ. 2022; Available from: https://asq.org/quality-resources/spaghetti-diagram. 2. NaviCare⢠Nurse Call | hill-rom.com. 2022; Available from: https://www.hill-rom.com/international/Products/Products-by-Category/clinical-workflow-solutions/NaviCare-Nurse-Call/. ------------------------ File: 2022-01-29-b52-health-IT.md Creation Date: "Fri, 27 Feb 2026 19:13:30 +0000" --- title: "What Can Healthcare IT Learn from the B-52?" categories: - Blog tags: - healthcare IT - maintenance - upgrades - aerospace engineering - technical debt - total cost of ownership --- A lot of aviation videos show up on my YouTube feed (thank you, [DarkAero](https://www.youtube.com/c/darkaeroinc) team). A video that popped up recently was about the Boeing B-52 Stratofortress (B-52) engine retrofit project. According to wikipedia the B-52 is a “long-range, subsonic, jet-powered strategic bomber” that has been used by the US Air Force since 1955. [1] Despite being designed and built 6 decades ago, the US Air Force still uses these planes and plans on using them well into the future. This desire to keep using them into the future is where things get interesting and we in healthcare IT can learn some lessons.  As an aside, my personal belief is machines like this are pretty odious. I like machines, I like making physical things, and I like planes. But when the thing in question is expressly designed to kill people and destroy property, I start to have some problems. Obviously there’s a reason why these exist (and why they’ve been used) but I find their existence troubling and I wish we lived in a world where these types of machines did not have to exist. The upgrading of these planes is covered well by wikipedia, an Air Force Magazine article, and the original YouTube video that sparked my interest in the topic. [1-3] Basically, the last B-52 rolled off the assembly line in 1962 and the Air Force has been refurbishing the original engines as time has gone on. In order to keep the planes flying into the 2040s the US government has decided to order new engines for the existing planes. Note an emerging connection, both the US government and US healthcare organizations are loathe to let old technology die. We gotta squeeze all the usable life out of those faxing systems… New engines old plane, makes sense right? Sure, but take another glance at the B-52 (image above). Look at how many engines there are. Four pairs of small jet engines, for a total of 8 engines! Seems like we have an opportunity to cut down on the number of engines, right? Two turbofan jet engines is the standard for most modern commercial aircraft being delivered by Boeing or Airbus these days. Even if we didn’t go down to two we could go down to four easily. No need to change the number of mounting points! This is very logical, but it’s not truly feasible. Why? Because of design decisions made 69 years ago. This underscores a concept that is not discussed widely enough in healthcare IT circles: > Your choices for tomorrow are ultimately constrained by what you designed yesterday. The jet engine technology of the 1950s ultimately informed how the rest of the B-52 was designed. The references go into more detail, but if you were to re-engine the B-52 with a smaller number of more powerful engines you would have to totally redesign other parts of the plane. For example the rudder, wings, and control systems would have to totally be redesigned. Doing that might mean that you’d have to rethink the fuselage as well. You would be better off designing a new airplane from the ground up. So the choice becomes maintain with significant constraints or totally redo. When thinking about the health IT landscape we can see this concept everywhere. Why do we still put up with aging faxing servers and paging systems that are down more often than not? Because we built a system around them and the costs associated with their wholesale replacement are not tenable. Healthcare IT budgets are not infinite, so more often than not we have to focus on how to keep things going by repeatedly doing smaller upgrades. The best we can do is to try to strike a balance between current capabilities and future-proofing. Even though the B-52 engine retrofit project is significantly constrained, the fact that we are still able to use it at all and will be able to keep it flying till 2040 is a testament to the prowess of the original engineers. And all the engineers who have worked on it since. There is an aspect to this longevity that is inspiring. However, it is important to ask: would it have been better to do a clean sheet design and pay-off the accrued technical debt? [4] This is a question that can be asked of healthcare IT as easily as it can be asked of the US military. Heck, over half of all patient in the US have their electronic health records coded up in a programming language that was originally released in 1966. [5, 6] Both healthcare IT and the US military are ponderous creatures that generally ascribe to “if it ain’t totally broke don’t fix it”. There’s a lot more to discuss on this topic. It closely relates to the concept of total cost of ownership (might dive into in the future). But its important to recognize how the decisions we make today will impact the decisions we can make in the future. Youtube video embedded below:
Erkin
[Go ÖN Home](../../index.md) ## Bibliography 1. Boeing B-52 Stratofortress - Wikipedia. 2022; Available from: https://en.wikipedia.org/wiki/Boeing_B-52_Stratofortress. 2. The B-52 is Getting New Engines... Why Does it Still Need 8 of Them? 3. Tirpak, J.A. Re-Engining the B-52. 2019; Available from: https://www.airforcemag.com/article/re-engining-the-b-52/. 4. Technical debt - Wikipedia. 2022; Available from: https://en.wikipedia.org/wiki/Technical_debt. 5. MUMPS - Wikipedia. 2022; Available from: https://en.wikipedia.org/wiki/MUMPS. 6. JEFF GLAZE jglaze@madison.com, -.-. Epic Systems draws on literature greats for its next expansion. 2022. ------------------------ File: 2022-02-01-Development-and-Validation-of-Models-to-Predict-Pathological-Outcomes-of-Radical-Prostatectomy-in-Regional-and-National-Cohorts.md Creation Date: "Fri, 27 Feb 2026 19:13:30 +0000" --- title: "Development and Validation of Models to Predict Pathological Outcomes of Radical Prostatectomy in Regional and National Cohorts" categories: - Blog - Research tags: - Blog - Research - urology - radical prostatectomy - prostate cancer - medicine - healthcare - artificial intelligence - machine learning --- The Journal of Urology article, read [here](https://doi.org/10.1097/JU.0000000000002230). [Download paper.](https://eotles.com/assets/papers/development_and_validation_of_models_to_predict_pathological_outcomes_of_radical_prostatectomy.pdf) ## Abstract ### Purpose Prediction models are recommended by national guidelines to support clinical decision making in prostate cancer. Existing models to predict pathological outcomes of radical prostatectomy (RP)—the Memorial Sloan Kettering (MSK) models, Partin tables, and the Briganti nomogram—have been developed using data from tertiary care centers and may not generalize well to other settings. ### Materials and Methods Data from a regional cohort (Michigan Urological Surgery Improvement Collaborative [MUSIC]) were used to develop models to predict extraprostatic extension (EPE), seminal vesicle invasion (SVI), lymph node invasion (LNI), and nonorgan-confined disease (NOCD) in patients undergoing RP. The MUSIC models were compared against the MSK models, Partin tables, and Briganti nomogram (for LNI) using data from a national cohort (Surveillance, Epidemiology, and End Results [SEER] registry). ### Results We identified 7,491 eligible patients in the SEER registry. The MUSIC model had good discrimination (SEER AUC EPE: 0.77; SVI: 0.80; LNI: 0.83; NOCD: 0.77) and was well calibrated. While the MSK models had similar discrimination to the MUSIC models (SEER AUC EPE: 0.76; SVI: 0.80; LNI: 0.84; NOCD: 0.76), they overestimated the risk of EPE, LNI, and NOCD. The Partin tables had inferior discrimination (SEER AUC EPE: 0.67; SVI: 0.76; LNI: 0.69; NOCD: 0.72) as compared to other models. The Briganti LNI nomogram had an AUC of 0.81 in SEER but overestimated the risk. ### Conclusions New models developed using the MUSIC registry outperformed existing models and should be considered as potential replacements for the prediction of pathological outcomes in prostate cancer. ------------------------ File: 2022-02-06-ehr-front-ends.md Creation Date: "Fri, 27 Feb 2026 19:13:30 +0000" --- title: "The Complicated Way You See Patient Data: A Discussion on EHR Front-Ends for Doctors" categories: - Blog tags: - healthcare IT - electronic health records - computer science - software engineering - software architecture - clinical informatics - tech support --- I have a love-hate relationship with electronic health records (EHRs). This relationship first started in the early 2000s at a high school sports physical and has significantly outlasted my high school soccer career. Eventually the relationship turned serious and my first job out of college was for an EHR vendor. My thrilling life as a support engineer at Epic Systems Corporation was cut short by my silly decision to pursue an MD-PhD. After years of being on one side of the software and data-stack I transitioned to being a “user" for the first time. While not totally naive to all of the issues surrounding modern EHRs this transition was still pretty eye opening. I believe a significant subset of these issues actually stem from a general lack of communication between the engineering community making these tools and the medical community using them. One of my goals in pursuing the MD-PhD was to hopefully help bridge this gap a little bit. As such, I’m usually game to play tech support on the wards and I like explaining how the software we use works (or doesn’t). I also like translating what we do in medicine to the engineers that will listen. Basically I’ll talk to any crowd that will listen (maybe this is why I went into academia 🤔).

[Go ÖN Home](../../index.md) ## Acknowledgements I’d like to thank [John Cheadle](https://www.linkedin.com/in/john-cheadle-59774339) and [River Karl](https://www.linkedin.com/in/river-karl-7b5a4349) for reviewing this work prior its posting. ## Bibliography 1. Frontend and backend - Wikipedia. 2022; Available from: https://en.wikipedia.org/wiki/Frontend_and_backend. 2. Client–server model - Wikipedia. 2022; Available from: https://en.wikipedia.org/wiki/Client%E2%80%93server_model. 3. JEFF GLAZE jglaze@madison.com, -.-. Epic Systems draws on literature greats for its next expansion. 2022. 4. Desktop virtualization - Wikipedia. 2022; Available from: https://en.wikipedia.org/wiki/Desktop_virtualization. 5. Citrix Workspace App - Wikipedia. 2022; Available from: https://en.wikipedia.org/wiki/Citrix_Workspace_App. ------------------------ File: 2022-02-15-needle-gauges.md Creation Date: "Fri, 27 Feb 2026 19:13:30 +0000" --- title: "Bigger Needle Smaller Number" categories: - Blog tags: - engineering - industrial engineering - medicine - hypodermic needles - gauges - measurement system - industrialization - standards header: teaser: "/assets/images/insta/IMG_4191.JPG" overlay_image: "/assets/images/insta/IMG_4191.JPG" --- This is going to be a short post because the last one about EHR front-ends was about 3 times longer than I had originally planned for it to be. A while ago I came across this wonderful tweetorial on the history of needle gauges. It is a summary of an article entitled “The story of the gauge” by Pöll. [1] Pöll traces the lineage of the Birmingham Wire Gauge (BWG) system (the measurement system we use to describe the diameter of the hypodermic needles). Its an interesting story that lays out how we ended up using a seemingly counterintuitive system developed in the 19th century to communicate the size of needles we want to use. As a med student we are taught to ask for “two-large bore” IVs when a patient is at risk of needing a large amount of blood or fluid transfused. My notes say this is 16 gauge or larger (I’ve seen 18 or larger as well). The “larger” part can be confusing when it comes to needle gauges. [2] This is because larger needle diameters actually have smaller gauge numbers.  The reason for this comes down to development of the BWG. It was developed to measure the thinness of drawn wire. Wire is drawn (or made thinner) by pulling metal through dies (holes in metal templates). You make the wire thinning by repeatedly drawing it through smaller holes. The numbering of these holes is the gauge. Thus the larger the gauge the thinner the wire (or needle). Reading through the history of how the BWG came to be the standard for wire (and needle) gauging is a good reminder that standards and nomenclature don’t emerge linearly in relation to the technology being used. I think this is especially true in healthcare where technology often gets ported after being developed elsewhere. Erkin
[Go ÖN Home](../../index.md) P.S. There are some really cool physical properties that interplay with gauge size. One has to do with intermolecular forces (van Der Waals forces), which lead to a neat relationship between the gauge sizes, each gauge is about 11% thinner than preceding gauge. [1] The second has to do with the flow rate through a needle which is related to the quadratic power of the radius of a needle. [2] ## Bibliography 1. Pöll, J.S., The story of the gauge. Anaesthesia, 1999. 54(6): p. 575-581. 2. Verhoeff, K., et al., Ensuring adequate vascular access in patients with major trauma: a quality improvement initiative. BMJ Open Quality, 2018. 7(1): p. e000090. ------------------------ File: 2022-02-17-Early-identification-of-patients-admitted-to-hospital-for-covid-19-at-risk-of-clinical-deterioration.md Creation Date: "Fri, 27 Feb 2026 19:13:30 +0000" --- title: "Early identification of patients admitted to hospital for covid-19 at risk of clinical deterioration: model development and multisite external validation study" categories: - Blog - Research tags: - Blog - Research - covid - deterioration index - early warning system - medicine - healthcare - artificial intelligence - machine learning header: teaser: "/assets/images/insta/IMG_2184.JPG" overlay_image: "/assets/images/insta/IMG_2184.JPG" --- British Medical Journal. Can be found [here](https://doi.org/10.1136/bmj-2021-068576). [Download paper.](https://eotles.com/assets/papers/early_identification_of_covid_inpatients_at_risk_of_clinical_deterioration.pdf) ## Abstract ### Objective To create and validate a simple and transferable machine learning model from electronic health record data to accurately predict clinical deterioration in patients with covid-19 across institutions, through use of a novel paradigm for model development and code sharing. ### Design Retrospective cohort study. ### Setting One US hospital during 2015-21 was used for model training and internal validation. External validation was conducted on patients admitted to hospital with covid-19 at 12 other US medical centers during 2020-21. ### Participants 33,119 adults (≥18 years) admitted to hospital with respiratory distress or covid-19. ### Main outcome measures An ensemble of linear models was trained on the development cohort to predict a composite outcome of clinical deterioration within the first five days of hospital admission, defined as in-hospital mortality or any of three treatments indicating severe illness: mechanical ventilation, heated high flow nasal cannula, or intravenous vasopressors. The model was based on nine clinical and personal characteristic variables selected from 2686 variables available in the electronic health record. Internal and external validation performance was measured using the area under the receiver operating characteristic curve (AUROC) and the expected calibration error—the difference between predicted risk and actual risk. Potential bed day savings were estimated by calculating how many bed days hospitals could save per patient if low risk patients identified by the model were discharged early. ### Results 9291 covid-19 related hospital admissions at 13 medical centers were used for model validation, of which 1510 (16.3%) were related to the primary outcome. When the model was applied to the internal validation cohort, it achieved an AUROC of 0.80 (95% confidence interval 0.77 to 0.84) and an expected calibration error of 0.01 (95% confidence interval 0.00 to 0.02). Performance was consistent when validated in the 12 external medical centers (AUROC range 0.77-0.84), across subgroups of sex, age, race, and ethnicity (AUROC range 0.78-0.84), and across quarters (AUROC range 0.73-0.83). Using the model to triage low risk patients could potentially save up to 7.8 bed days per patient resulting from early discharge. ### Conclusion A model to predict clinical deterioration was developed rapidly in response to the covid-19 pandemic at a single hospital, was applied externally without the sharing of data, and performed well across multiple medical centers, patient subgroups, and time periods, showing its potential as a tool for use in optimizing healthcare resources. ------------------------ File: 2022-02-21-call-tech-support.md Creation Date: "Fri, 27 Feb 2026 19:13:30 +0000" --- title: "Why Doctors Should Contact Tech Support" categories: - Blog tags: - tech support - health IT - healthcare - medicine - enterprise software header: teaser: "/assets/images/insta/IMG_2025.JPG" overlay_image: "/assets/images/insta/IMG_2025.JPG" --- > If you see something, say something. This post is a manifesto on reporting bad health information technology (HIT) problems. If you’re having HIT problems complain about ‘em! I know everyone in medicine is conditioned not to complain and to deal with the crappiness of the “system”. But HIT is an area of healthcare where you can make a difference just by complaining. While a lot of the problems in HIT run pretty deep (*cough* usability *cough*) there are many things that can be fixed if attention is brought to them. These are things like: changing the order of columns on the team patient sign-off/hand-off report, stopping a best practice alert that no longer matches your clinical practice, or improving the loading time of a patient’s chart. None of these are big changes that involve redesigning user-interfaces or re-factoring server-side code. They are simple changes that will make the task of using HIT less arduous. If you put in a help-desk ticket with your hospital’s HIT team its very likely that they can fix the issue quickly and slightly improve your experience. 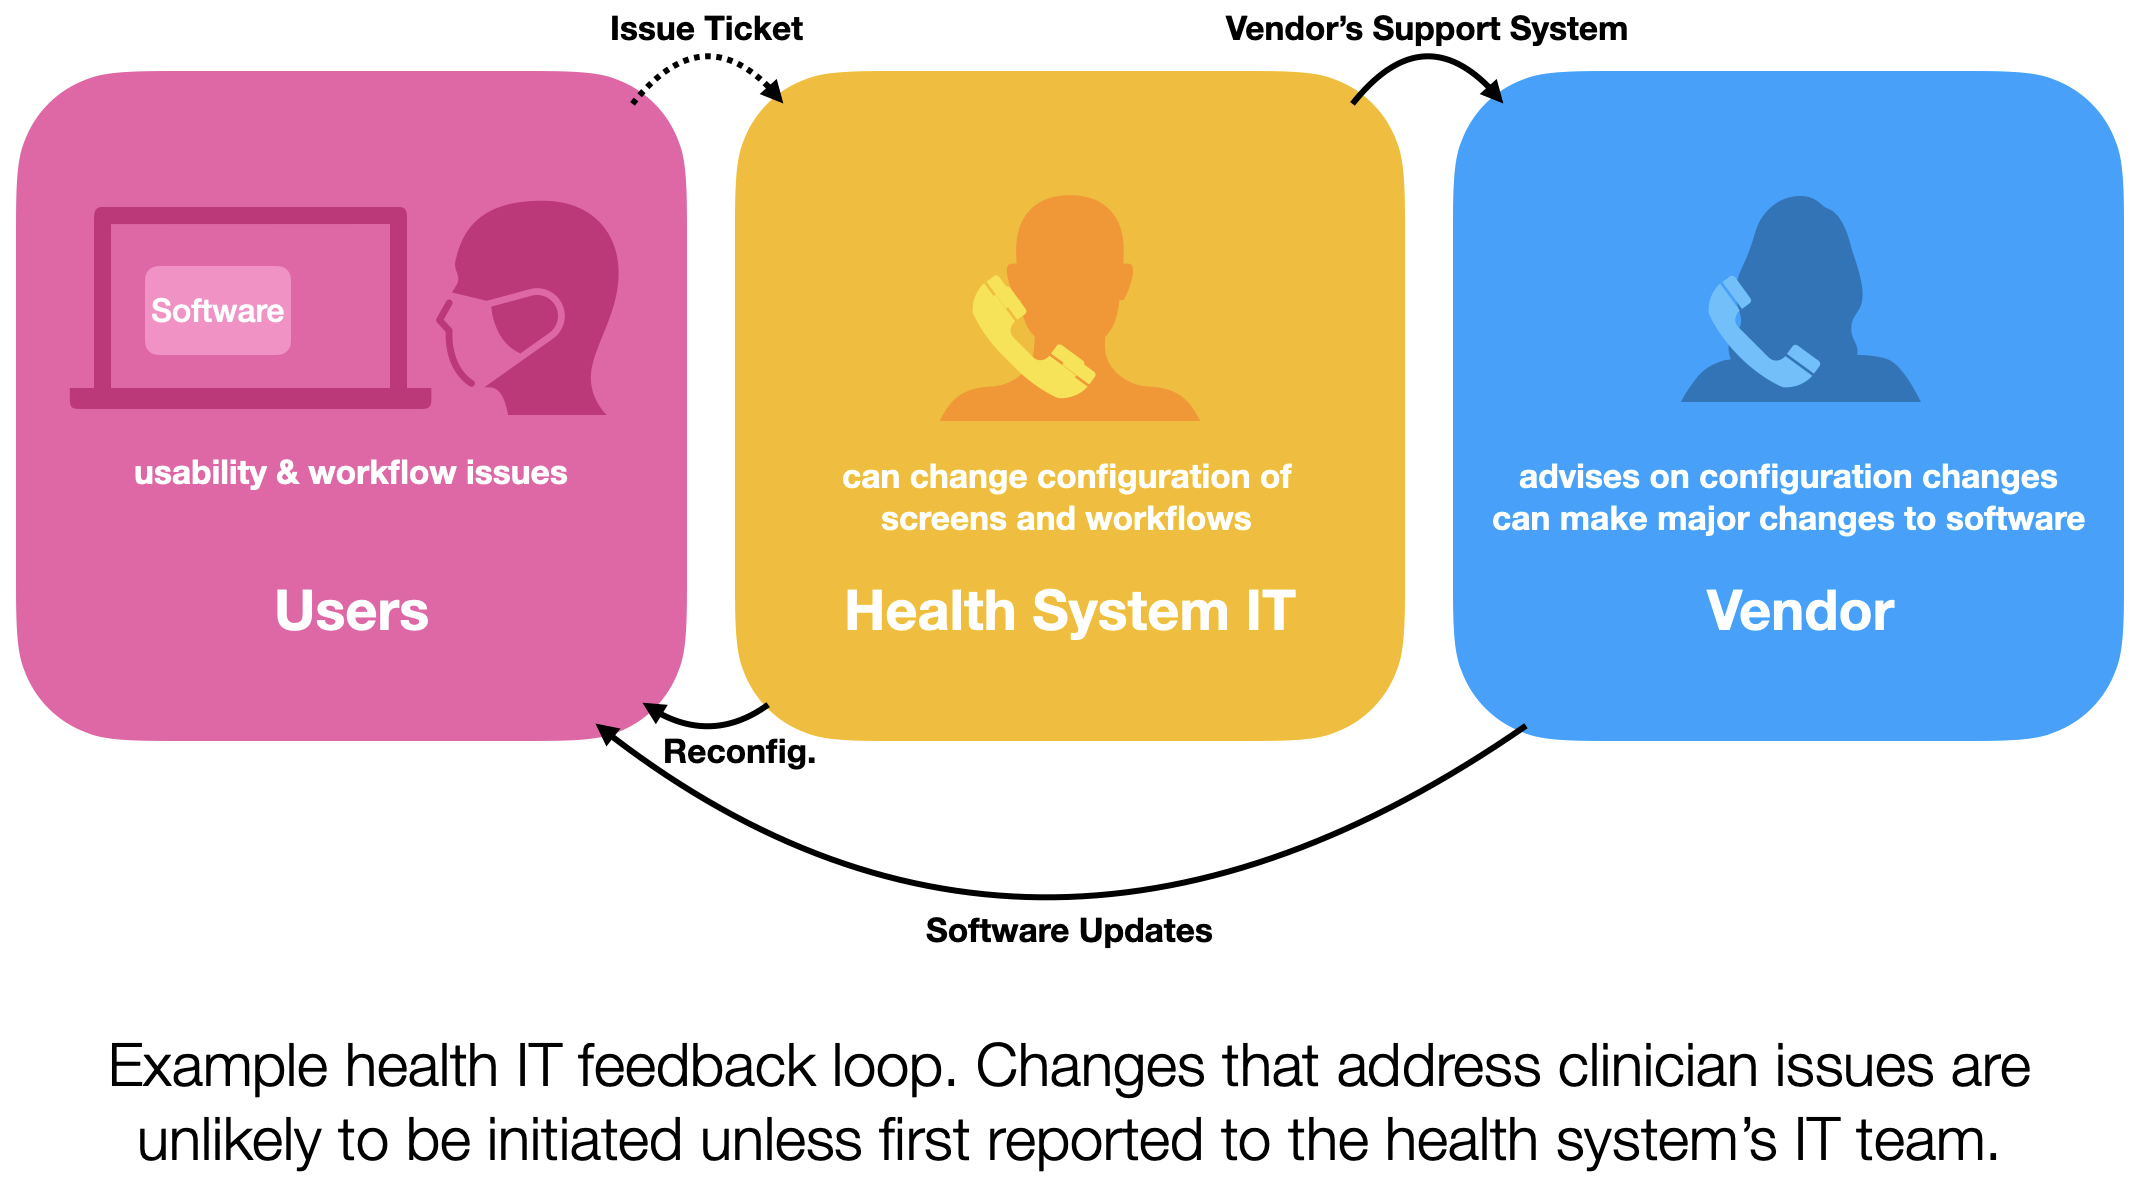 You might say “well I don’t do that with any of the other software I use” and that’s true. I don’t think I’ve ever reached out to tech support for Microsoft Word, iOS, or Instagram. There’s a couple reasons for this, but the one most relevant to our discussion is feedback. The developers of most consumer software may actually USE their software on a daily basis. So there’s a very tight feedback loop. With healthcare IT this feedback loop is long and leaky. Let’s take the electronic health records (EHRs). Most EHR systems are sold to health systems as enterprise software. That is software that one company sells (or licenses) to another company (the health system). The health system then has their clinicians use the EHR. This setup means that there are several tiers of support for the software. Additionally the software company specializes in making software, not using it, so their developers may not have a good sense of how the software works “in the wild”. Contrast this with a developer at Slack, who may use Slack to interact with their coworkers. User feedback doesn’t naturally occur in the EHR development space. So what do we do? We use the system! There’s a feedback loop built in for us, but its not widely known. That feedback loop is initiated by reporting issues. When a doctor or nurse reports an issue to their health system’s HIT team that should kick-off the feedback process. Your issue ticket will be triaged and then sent to the people who can fix it, either the HIT team or the software vendor. Neither of those teams are going to do anything for you if you don’t tell them what’s wrong. So report your issues. Your HIT team might fix them. Your software vendor might make an improvement in the future. Your work tech life might get an iota better and your colleagues might thank you. Sure there’s a lot of “mights”. But these things won’t happen if you don’t say something first. Erkin
[Go ÖN Home](../../index.md)
P.S. while writing this I found myself mulling over the bad tech support experiences I’ve had in the past. As someone who was essentially in tech support I’ve developed some techniques that I can share in another post if people are interest. Additionally, tech support for HIT should not be a blackhole, if it is that’s a red flag and should be rectified. Stifling this feedback loop is a surefire way to miss critical safety issues. ------------------------ File: 2022-03-01-intro-to-ml-part-i.md Creation Date: "Fri, 27 Feb 2026 19:13:30 +0000" --- title: "Intro to Machine Learning Models for Physicians: Part I" categories: - Blog tags: - machine learning - artificial intelligence - operations research - statistics - healthcare - medicine header: teaser: "/assets/images/insta/IMG_1613.JPG" overlay_image: "/assets/images/insta/IMG_1613.JPG" --- This a foundational post that has two aims. The first is to demystify machine learning which I believe is key to enabling physicians and other clinicians to become empowered users of the machine learning tools they use. There’s a bit of ground I want to cover, so this post will be broken into several parts. This part situates and introduces machine learning then discusses the important components of machine learning models. 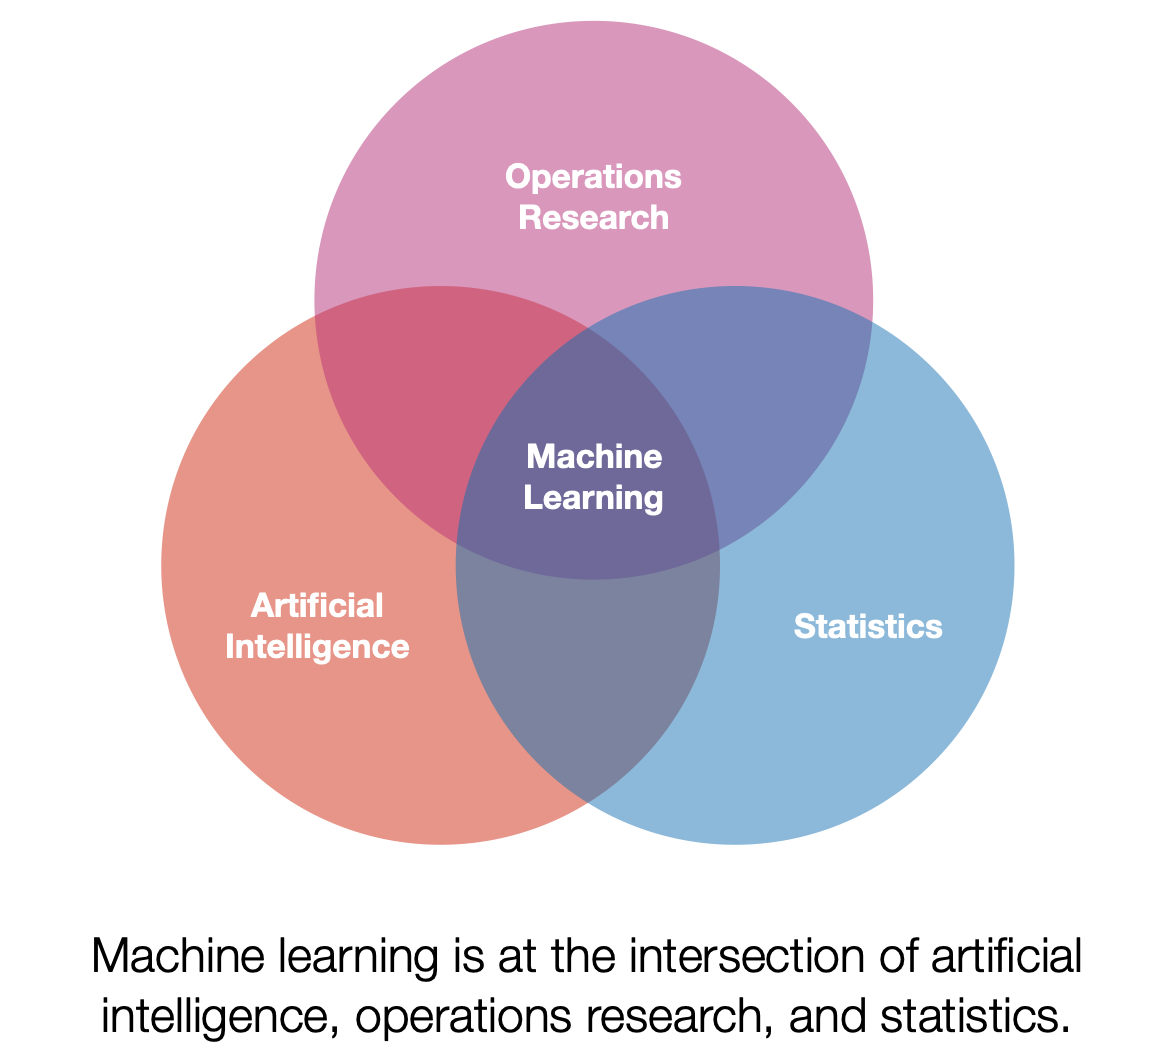 ## An Introduction First a note on terminology. Machine learning (ML) can mean a lot of different things depending on who you ask. I personally view ML as a subset of artificial intelligence that has a strong focus on using data to build models. Additionally, ML has significant overlaps with operations research and statistics. One of my favorite definitions of ML models is presented by Tom Mitchell. [1] Paraphrased below: > A model is said to learn from experience if its performance at a task improves with experience. Quick note, the term _model_ will be more fully explained below. This set up lends itself well to analogy. One potential analogy is that of a small child learning how to stack blocks. The child may start from a point where it is unable to stack blocks, it will repeatedly attempt stacking, and eventually will master how to stack blocks in various situations. In this analogy stacking blocks is the task, the repeated attempts at stacking is the experience, and the performance is some criteria the child uses to assess how well they are stacking (e.g., height or stability). We will now discuss this general definition for the specific use case of ML for healthcare. To contextualize this discussion we will focus on the ML model types that are most widely used in healthcare, _supervised offline learning_.[^1] Let’s break it down bit by bit. First, _supervised learning_ constrains the learning process by introducing supervisory information, this information can be thought of as a teacher that tells the model if they got the task correct. This is very useful when trying to evaluate the performance of the model. In addition to being supervised the models used for healthcare are often developed in an _offline_ setting. Offline describes the manner in which the model gains experience. Instead of learning from direct interaction with their environment they gain their experience by using information that has already been collected. 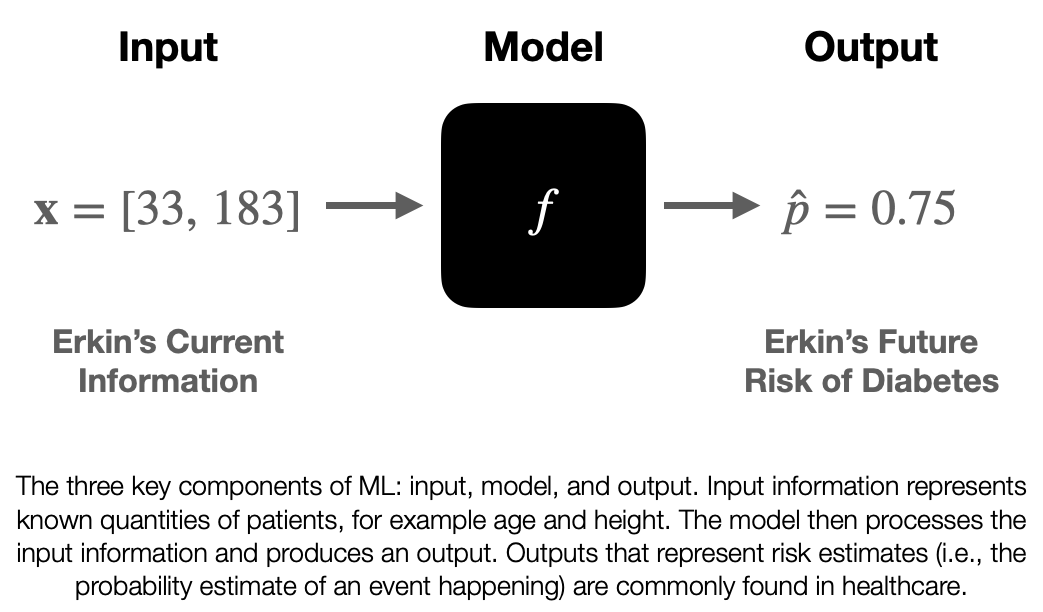 ## What is an ML model? We’ve been talking about the concept of the model pretty abstractly, so let’s nail it down now. A model is a mathematical function, f, that operates on information, taking in input information and returning output information. This function f is the thing that “learns from experience”, however in our case the function has stopped learning by the time it is ready to be used. So when it is implemented in an EHR system f is usually fixed. We will discuss how f is created in the next blog post, but for now let’s treat it like a black box and discuss the information it interacts with. The input information is known as **x**. Unlike the **x** you were introduced to in algebra class it actually represents information that we know. This information can take different forms depending on what information represents, but it is common to see **x** represent a list (or vector) of numbers. For example, if we wanted to give a model my age and height as input information you could set **x**=[33, 183], where 33 is my age in years and 183 is my height in centimeters. The output of a model may vary based on use-case and may be a little opaque. I’ll present my notation (which may differ from what you see elsewhere), I believe this is notation is the easiest to understand. In healthcare we are often interested in risk stratification models that output risk estimates, denoted as
[Go ÖN Home](../../index.md)
[^1]: Note ML is not a monolith and there are many different techniques that fall under the general umbrella of ML and I may cover some of the different types of ML in another post (e.g. unsupervised and reinforcement learning). ## Bibliography 1. Mitchell, T.M., Machine Learning. McGraw-Hill series in computer science. 1997, New York: McGraw-Hill. xvii, 414 p. 2. Wong, A., et al., External Validation of a Widely Implemented Proprietary Sepsis Prediction Model in Hospitalized Patients. JAMA Internal Medicine, 2021. ### Footnotes ------------------------ File: 2022-03-07-doctors-notes-software-prototype.md Creation Date: "Fri, 27 Feb 2026 19:13:30 +0000" --- title: "Doctor’s Notes Software Prototype" categories: - Blog - Project tags: - health IT - doctor’s notes - electronic health records - software design - UI/UX - human factors engineering excerpt: "A project that was focused on examining and improving the way doctor’s notes are written." header: teaser: "/assets/images/insta/IMG_1087.JPG" overlay_image: "/assets/images/insta/IMG_1087.JPG" --- We will return to the “Intro to ML for Physicians” series next week. In the intervening time here’s a short post about a prototype health IT app I made a two years ago. I made this app as part of a team project that was focused on examining and improving the way doctor’s notes are written.  Nominally this was a graduate project (holler at my HCI team[^1]) and the project specification called for making a low-functionality prototype using invision. [1], We did this and found it unsatisfying. The reason for this was that we wanted to incorporate a voice transcription interface into the note writing process. Although we could replicate some of the other functionality there was no way to build voice transcription and other key functionality in the prototyping software. So I took the logical nextstep[^2] and built out a minimal viable prototype using Apple’s development tools. This allowed me to incorporate on-device transcription. [2, 3] On-device transcription is a really cool technology for healthcare IT! Because you don’t have information flowing off the device back to Apple’s (or someone else’s) servers, it could enable HIPAA compliant voice interfaces in the future. Making a prototype app also enabled me to build several other features, such as saving and retrieving notes. These features are necessary when testing out a more complicated record keeping system, like this. If you are interested in learning more about this prototype check out this video: If you would like to take a look at my hacky Swift code check out the [Github project](https://github.com/eotles/HCI).
One thing that I didn’t have time to code up was the sharing of notes between physicians. This is a pain point in systems that are actually in use. The team had some cool ideas about collaborative editing and version control. I think these would be super useful from both a clinical perspective (making the sharing, editing, and co-signing easier) and also from a technical perspective. However that would involve a significant amount of back-end development (see: [Complicated Way You See Patient Data: EHR Front-Ends](https://eotles.github.io/blog/posts/20220206_ehr_front_ends/)) so it remains an item todo. One of my mantras is that there’s a lot of work to be done in healthcare IT. Developing prototypes and testing them out can help us advance the state of the field. Rapidly prototyping these systems is hard to do, but it could pay dividends in terms of physician happiness and productivity. Erkin ## P.S. Although I’ve made a couple other apps using Xcode and Swift this was my first time using SwiftUI, which was a pretty slick experience.[4] I really enjoyed programmatically creating the interface and not having to toggle back and forth between my view controller code and the Interface Builder. ## Acknowledgements I’d like to thank the team: [Sarah Jabbour](https://sjabbour.github.io), [Meera Krishnamoorthy](http://meera.krishnamoorthy.com), [Barbara Korycki](https://www.linkedin.com/in/barbara-korycki-19568810a/), and [Harry Rubin-Falcone](https://www.linkedin.com/in/harry-rubin-falcone-a6543960/). Making wireframes with you guys was an absolute joy. ## Bibliography 1. Prototype | InVision. 2022; Available from: https://www.invisionapp.com/defined/prototype. 2. Bolella, D. SpeechTranslatorSwiftUI Github Project. Available from: https://github.com/dbolella/SpeechTranslatorSwiftUI. 3. Recognizing Speech in Live Audio | Apple Developer Documentation. 2022; Available from: https://developer.apple.com/documentation/speech/recognizing_speech_in_live_audio. 4. SwiftUI Tutorials | Apple Developer Documentation. 2022; Available from: https://developer.apple.com/tutorials/swiftui. ### Footnotes [^1]: Sarah Jabbour, Meera Krishnamoorthy, Barbara Korycki, and Harry Rubin-Falcone [^2]: kudos if you got the joke ------------------------ File: 2022-04-02-AR-example.md Creation Date: "Fri, 27 Feb 2026 19:13:30 +0000" --- title: "Augmented Reality Demo" categories: - Blog tags: - AR/VR/XR --- This is an augmented reality (AR) demo using Apple's Augmented Reality tools. The 3D asset is a USDZ file created by [Apple](https://developer.apple.com/augmented-reality/quick-look/) (they own all rights to it). It is hosted as file uploaded to this GitHub repository. [Click this link to check it out.](https://github.com/eotles/blog/blob/gh-pages/posts/20220402_AR_example/toy_biplane.usdz?raw=true) It will download the file to your device. If it is an iOS device it should automatically open up the AR Quick Look functionality. Erkin
[Go ÖN Home](../../index.md)
------------------------ File: 2022-08-29-Dynamic-prediction-of-work-status-for-workers-with-occupational-injuries.md Creation Date: "Fri, 27 Feb 2026 19:13:30 +0000" --- title: "Dynamic prediction of work status for workers with occupational injuries: assessing the value of longitudinal observations" categories: - Blog - Research tags: - Blog - Research - occupational health - return to work - medicine - healthcare - artificial intelligence - machine learning header: teaser: "/assets/images/insta/IMG_1609.JPG" overlay_image: "/assets/images/insta/IMG_1609.JPG" --- Journal of the American Medical Informatics Association manuscript, can be found [here](https://doi.org/10.1093/jamia/ocac130).
 [Download abstract.](https://eotles.com/assets/papers/dynamic_prediction_of_work_status_for_workers_with_occupational_injuries.pdf)
## Abstract
### Objective
Occupational injuries (OIs) cause an immense burden on the US population. Prediction models help focus resources on those at greatest risk of a delayed return to work (RTW). RTW depends on factors that develop over time; however, existing methods only utilize information collected at the time of injury. We investigate the performance benefits of dynamically estimating RTW, using longitudinal observations of diagnoses and treatments collected beyond the time of initial injury.
### Materials and Methods
We characterize the difference in predictive performance between an approach that uses information collected at the time of initial injury (baseline model) and a proposed approach that uses longitudinal information collected over the course of the patient’s recovery period (proposed model). To control the comparison, both models use the same deep learning architecture and differ only in the information used. We utilize a large longitudinal observation dataset of OI claims and compare the performance of the two approaches in terms of daily prediction of future work state (working vs not working). The performance of these two approaches was assessed in terms of the area under the receiver operator characteristic curve (AUROC) and expected calibration error (ECE).
### Results
After subsampling and applying inclusion criteria, our final dataset covered 294 103 OIs, which were split evenly between train, development, and test datasets (1/3, 1/3, 1/3). In terms of discriminative performance on the test dataset, the proposed model had an AUROC of 0.728 (90% confidence interval: 0.723, 0.734) versus the baseline’s 0.591 (0.585, 0.598). The proposed model had an ECE of 0.004 (0.003, 0.005) versus the baseline’s 0.016 (0.009, 0.018).
### Conclusion
The longitudinal approach outperforms current practice and shows potential for leveraging observational data to dynamically update predictions of RTW in the setting of OI. This approach may enable physicians and workers’ compensation programs to manage large populations of injured workers more effectively.
------------------------
File: 2022-08-30-IOE-RTW-JAMIA-Press.md
Creation Date: "Fri, 27 Feb 2026 19:13:30 +0000"
---
title: "Helping people get back to work using deep learning in the occupational health system"
categories:
- Blog
- Press
tags:
- Blog
- Press
- occupational health
- return to work
- medicine
- healthcare
- artificial intelligence
- machine learning
header:
teaser: "/assets/images/insta/IMG_1408.JPG"
overlay_image: "/assets/images/insta/IMG_1408.JPG"
---
Discussed our recent [JAMIA paper on predicting return to work](/blog/research/Dynamic-prediction-of-work-status-for-workers-with-occupational-injuries/) with Jessalyn Tamez. Check out the news brief [here](https://ioe.engin.umich.edu/2022/08/30/helping-people-get-back-to-work-using-deep-learning-in-the-occupational-health-system/).
------------------------
File: 2022-09-19-Prospective-evaluation-of-data-driven-models-to-predict-daily-risk-of-clostridioides-difficile-infection-at-2-large-academic-health-centers.md
Creation Date: "Fri, 27 Feb 2026 19:13:30 +0000"
---
title: "Prospective evaluation of data-driven models to predict daily risk of Clostridioides difficile infection at 2 large academic health centers"
categories:
- Blog
- Research
tags:
- Blog
- Research
- Clostridioides difficile
- infectious disease
- early warning system
- medicine
- healthcare
- artificial intelligence
- machine learning
header:
teaser: "/assets/images/insta/IMG_1144.JPG"
overlay_image: "/assets/images/insta/IMG_1144.JPG"
---
Infection Control and Hospital Epidemiology. Can be found [here](https://doi.org/10.1017/ice.2022.218).
[Download paper.](https://eotles.com/assets/papers/prospective_evaluation_of_data_driven_models_to_predict_daily_risk_of_clostridioides_difficile_infection_at_2-large_academic_health_centers.pdf)
## Abstract
Many data-driven patient risk stratification models have not been evaluated prospectively. We performed and compared the prospective and retrospective evaluations of 2 Clostridioides difficile infection (CDI) risk-prediction models at 2 large academic health centers, and we discuss the models’ robustness to data-set shifts.
------------------------
File: 2022-09-19-UMich-IOE-Promo-Video.md
Creation Date: "Fri, 27 Feb 2026 19:13:30 +0000"
---
title: "UMich IOE Promo Video"
categories:
- Blog
tags:
- Blog
- industrial engineering
- operations research
---
Was featured in the University of Michigan Department of Industrial and Operations Engineering promotional video.
> University of Michigan Industrial and Operations Engineering graduates are in high demand and use mathematics, and data analytics to launch their careers and create solutions across the globe in business, consulting, energy, finance, healthcare, manufacturing, robotics, aerospace, transportation, supply chain and more.
------------------------
File: 2022-11-02-Using-NLP-to-determine-factors-associated-with-high-quality-feedback.md
Creation Date: "Fri, 27 Feb 2026 19:13:30 +0000"
---
title: "Using natural language processing to determine factors associated with high‐quality feedback"
categories:
- Blog
- Research
tags:
- Blog
- Research
- medicine
- healthcare
- artificial intelligence
- machine learning
- natural language processing
- medical education
- SIMPL
header:
teaser: "/assets/images/insta/IMG_0591.JPG"
overlay_image: "/assets/images/insta/IMG_0591.JPG"
---
Global Surgical Education. Can be found [here](https://doi.org/10.1007/s44186-022-00051-y).
[Download paper.](https://eotles.com/assets/papers/using_NLP_to_determine_factors_associated_with_high_quality_feedback.pdf)
## Abstract
### Purpose
Feedback is a cornerstone of medical education. However, not all feedback that residents receive is high-quality. Natural language processing (NLP) can be used to efficiently examine the quality of large amounts of feedback. We used a validated NLP model to examine factors associated with the quality of feedback that general surgery trainees received on 24,531 workplace-based assessments of operative performance.
### Methods
We analyzed transcribed, dictated feedback from the Society for Improving Medical Professional Learning’s (SIMPL) smartphone-based app. We first applied a validated NLP model to all SIMPL evaluations that had dictated feedback, which resulted in a predicted probability that an instance of feedback was “relevant”, “specific”, and/or “corrective.” Higher predicted probabilities signaled an increased likelihood that feedback was high quality. We then used linear mixed-effects models to examine variation in predictive probabilities across programs, attending surgeons, trainees, procedures, autonomy granted, operative performance level, case complexity, and a trainee’s level of clinical training.
### Results
Linear mixed-effects modeling demonstrated that predicted probabilities, i.e., a proxy for quality, were lower as operative autonomy increased (“Passive Help” B = − 1.29, p < .001; “Supervision Only” B = − 5.53, p < 0.001). Similarly, trainees who demonstrated “Exceptional Performance” received lower quality feedback (B = − 12.50, p < 0.001). The specific procedure or trainee did not have a large effect on quality, nor did the complexity of the case or the PGY level of a trainee. The individual faculty member providing the feedback, however, had a demonstrable impact on quality with approximately 36% of the variation in quality attributable to attending surgeons.
### Conclusions
We were able to identify actionable items affecting resident feedback quality using an NLP model. Attending surgeons are the most influential factor in whether feedback is high quality. Faculty should be directly engaged in efforts to improve the overall quality of feedback that residents receive.
------------------------
File: 2022-12-20-Teaching-AI.md
Creation Date: "Fri, 27 Feb 2026 19:13:30 +0000"
---
title: "Teaching AI as a Fundamental Toolset of Medicine"
categories:
- Blog
- Research
tags:
- Blog
- Research
- medical education
- medical school
- artificial intelligence
- machine learning
header:
teaser: "/assets/images/insta/IMG_0440.JPG"
overlay_image: "/assets/images/insta/IMG_0440.JPG"
---
New article out in Cell Reports Medicine. It is a [perspective paper on incorporating AI into medical education](https://doi.org/10.1016/j.xcrm.2022.100824) with Drs. Cornelius A. James, Kimberly D. Lomis, and James Woolliscroft.
[Download paper.](https://eotles.com/assets/papers/teaching_AI_as_a_fundamental_toolset_of_medicine.pdf)
## Abstract
Artificial intelligence (AI) is transforming the practice of medicine. Systems assessing chest radiographs, pathology slides, and early warning systems embedded in electronic health records (EHRs) are becoming ubiquitous in medical practice. Despite this, medical students have minimal exposure to the concepts necessary to utilize and evaluate AI systems, leaving them under prepared for future clinical practice. We must work quickly to bolster undergraduate medical education around AI to remedy this. In this commentary, we propose that medical educators treat AI as a critical component of medical practice that is introduced early and integrated with the other core components of medical school curricula. Equipping graduating medical students with this knowledge will ensure they have the skills to solve challenges arising at the confluence of AI and medicine.
------------------------
File: 2023-01-12-STAT-News-medical-schools-missing-mark-on-AI.md
Creation Date: "Fri, 27 Feb 2026 19:13:30 +0000"
---
title: "STAT News: How medical schools are missing the mark on artificial intelligence"
categories:
- Blog
- Press
tags:
- Blog
- Press
- artificial intelligence
- machine learning
- medical education
- medical school
- STAT News
header:
teaser: "/assets/images/insta/IMG_0388.JPG"
overlay_image: "/assets/images/insta/IMG_0388.JPG"
---
Discussed my recent [perspective paper on incorporating AI into medical education](https://www.sciencedirect.com/science/article/pii/S2666379122003834) with Dr. James Woolliscroft and Katie Palmer of STAT News. Check out the full discussion [here](https://www.statnews.com/2023/01/12/medical-school-artificial-intelligence-health-curriculum/).
------------------------
File: 2023-02-22-RISE-VTC-AI-MedEd.md
Creation Date: "Fri, 27 Feb 2026 19:13:30 +0000"
---
title: "RISE Virtual Talking Circle: Innovations in Machine Learning and Artificial Intelligence for Application in Education"
categories:
- Blog
- Talk
tags:
- medicine
- machine learning
- artificial intelligence
- medical educcation
header:
teaser: "/assets/images/insta/IMG_0302.JPG"
overlay_image: "/assets/images/insta/IMG_0302.JPG"
---
University of Michigan Medical School RISE (Research. Innovation. Scholarship. Education) virtual talking circle discussion with Dr. Cornelius James.
Discussed the need for integration of AI education into undergraduate medical education (medical school). Echoed some of the findings from our [Cell Reports Medicine paper](https://www.sciencedirect.com/science/article/pii/S2666379122003834).
[Link to presentation.](https://eotles.com/assets/presentations/2023_RISE_VTC/AI_RISE_VTC.pdf)
------------------------
File: 2023-03-16-NAM-AI-HPE.md
Creation Date: "Fri, 27 Feb 2026 19:13:30 +0000"
---
title: "National Academy of Medicine: AI in Health Professions Education Workshop"
categories:
- Blog
- Talk
tags:
- medicine
- machine learning
- artificial intelligence
- medical education
- national academies
header:
teaser: "/assets/images/insta/IMG_0212.JPG"
overlay_image: "/assets/images/insta/IMG_0212.JPG"
---
Panel discussion on AI in health professions education.
I joined a panel of learners to share our perspectives on how AI should be incorporated into health professions education. Moderated by Mollie Hobensack and Dr. Cornelius James.
Panelists included: Noahlana Monzon, CPMA Nutrition Student, University of Oklahoma, Dallas Peoples, PhD Candidate in Sociology, Texas Woman's University, Winston Guo, MD Candidate, Weill Cornell Medical College, Gabrielle Robinson, PhD Student in Medical Clinical Psychology, Uniformed Services, University of the Health Sciences, Alonzo D. Turner, PhD Student, Counseling and Counselor Education, Syracuse University & 2022 NBCC Doctoral Minority Fellow and myself.
------------------------
File: 2023-03-23-html-svg-experiments.md
Creation Date: "Fri, 27 Feb 2026 19:13:30 +0000"
---
title: HTML/SVG Experiment
categories:
- Blog
tags:
- Blog
- HTML
- SVG
header:
teaser: "/assets/images/random_gradient_hello.svg"
overlay_image: "/assets/images/random_gradient_hello.svg"
---
[Download abstract.](https://eotles.com/assets/papers/dynamic_prediction_of_work_status_for_workers_with_occupational_injuries.pdf)
## Abstract
### Objective
Occupational injuries (OIs) cause an immense burden on the US population. Prediction models help focus resources on those at greatest risk of a delayed return to work (RTW). RTW depends on factors that develop over time; however, existing methods only utilize information collected at the time of injury. We investigate the performance benefits of dynamically estimating RTW, using longitudinal observations of diagnoses and treatments collected beyond the time of initial injury.
### Materials and Methods
We characterize the difference in predictive performance between an approach that uses information collected at the time of initial injury (baseline model) and a proposed approach that uses longitudinal information collected over the course of the patient’s recovery period (proposed model). To control the comparison, both models use the same deep learning architecture and differ only in the information used. We utilize a large longitudinal observation dataset of OI claims and compare the performance of the two approaches in terms of daily prediction of future work state (working vs not working). The performance of these two approaches was assessed in terms of the area under the receiver operator characteristic curve (AUROC) and expected calibration error (ECE).
### Results
After subsampling and applying inclusion criteria, our final dataset covered 294 103 OIs, which were split evenly between train, development, and test datasets (1/3, 1/3, 1/3). In terms of discriminative performance on the test dataset, the proposed model had an AUROC of 0.728 (90% confidence interval: 0.723, 0.734) versus the baseline’s 0.591 (0.585, 0.598). The proposed model had an ECE of 0.004 (0.003, 0.005) versus the baseline’s 0.016 (0.009, 0.018).
### Conclusion
The longitudinal approach outperforms current practice and shows potential for leveraging observational data to dynamically update predictions of RTW in the setting of OI. This approach may enable physicians and workers’ compensation programs to manage large populations of injured workers more effectively.
------------------------
File: 2022-08-30-IOE-RTW-JAMIA-Press.md
Creation Date: "Fri, 27 Feb 2026 19:13:30 +0000"
---
title: "Helping people get back to work using deep learning in the occupational health system"
categories:
- Blog
- Press
tags:
- Blog
- Press
- occupational health
- return to work
- medicine
- healthcare
- artificial intelligence
- machine learning
header:
teaser: "/assets/images/insta/IMG_1408.JPG"
overlay_image: "/assets/images/insta/IMG_1408.JPG"
---
Discussed our recent [JAMIA paper on predicting return to work](/blog/research/Dynamic-prediction-of-work-status-for-workers-with-occupational-injuries/) with Jessalyn Tamez. Check out the news brief [here](https://ioe.engin.umich.edu/2022/08/30/helping-people-get-back-to-work-using-deep-learning-in-the-occupational-health-system/).
------------------------
File: 2022-09-19-Prospective-evaluation-of-data-driven-models-to-predict-daily-risk-of-clostridioides-difficile-infection-at-2-large-academic-health-centers.md
Creation Date: "Fri, 27 Feb 2026 19:13:30 +0000"
---
title: "Prospective evaluation of data-driven models to predict daily risk of Clostridioides difficile infection at 2 large academic health centers"
categories:
- Blog
- Research
tags:
- Blog
- Research
- Clostridioides difficile
- infectious disease
- early warning system
- medicine
- healthcare
- artificial intelligence
- machine learning
header:
teaser: "/assets/images/insta/IMG_1144.JPG"
overlay_image: "/assets/images/insta/IMG_1144.JPG"
---
Infection Control and Hospital Epidemiology. Can be found [here](https://doi.org/10.1017/ice.2022.218).
[Download paper.](https://eotles.com/assets/papers/prospective_evaluation_of_data_driven_models_to_predict_daily_risk_of_clostridioides_difficile_infection_at_2-large_academic_health_centers.pdf)
## Abstract
Many data-driven patient risk stratification models have not been evaluated prospectively. We performed and compared the prospective and retrospective evaluations of 2 Clostridioides difficile infection (CDI) risk-prediction models at 2 large academic health centers, and we discuss the models’ robustness to data-set shifts.
------------------------
File: 2022-09-19-UMich-IOE-Promo-Video.md
Creation Date: "Fri, 27 Feb 2026 19:13:30 +0000"
---
title: "UMich IOE Promo Video"
categories:
- Blog
tags:
- Blog
- industrial engineering
- operations research
---
Was featured in the University of Michigan Department of Industrial and Operations Engineering promotional video.
> University of Michigan Industrial and Operations Engineering graduates are in high demand and use mathematics, and data analytics to launch their careers and create solutions across the globe in business, consulting, energy, finance, healthcare, manufacturing, robotics, aerospace, transportation, supply chain and more.
------------------------
File: 2022-11-02-Using-NLP-to-determine-factors-associated-with-high-quality-feedback.md
Creation Date: "Fri, 27 Feb 2026 19:13:30 +0000"
---
title: "Using natural language processing to determine factors associated with high‐quality feedback"
categories:
- Blog
- Research
tags:
- Blog
- Research
- medicine
- healthcare
- artificial intelligence
- machine learning
- natural language processing
- medical education
- SIMPL
header:
teaser: "/assets/images/insta/IMG_0591.JPG"
overlay_image: "/assets/images/insta/IMG_0591.JPG"
---
Global Surgical Education. Can be found [here](https://doi.org/10.1007/s44186-022-00051-y).
[Download paper.](https://eotles.com/assets/papers/using_NLP_to_determine_factors_associated_with_high_quality_feedback.pdf)
## Abstract
### Purpose
Feedback is a cornerstone of medical education. However, not all feedback that residents receive is high-quality. Natural language processing (NLP) can be used to efficiently examine the quality of large amounts of feedback. We used a validated NLP model to examine factors associated with the quality of feedback that general surgery trainees received on 24,531 workplace-based assessments of operative performance.
### Methods
We analyzed transcribed, dictated feedback from the Society for Improving Medical Professional Learning’s (SIMPL) smartphone-based app. We first applied a validated NLP model to all SIMPL evaluations that had dictated feedback, which resulted in a predicted probability that an instance of feedback was “relevant”, “specific”, and/or “corrective.” Higher predicted probabilities signaled an increased likelihood that feedback was high quality. We then used linear mixed-effects models to examine variation in predictive probabilities across programs, attending surgeons, trainees, procedures, autonomy granted, operative performance level, case complexity, and a trainee’s level of clinical training.
### Results
Linear mixed-effects modeling demonstrated that predicted probabilities, i.e., a proxy for quality, were lower as operative autonomy increased (“Passive Help” B = − 1.29, p < .001; “Supervision Only” B = − 5.53, p < 0.001). Similarly, trainees who demonstrated “Exceptional Performance” received lower quality feedback (B = − 12.50, p < 0.001). The specific procedure or trainee did not have a large effect on quality, nor did the complexity of the case or the PGY level of a trainee. The individual faculty member providing the feedback, however, had a demonstrable impact on quality with approximately 36% of the variation in quality attributable to attending surgeons.
### Conclusions
We were able to identify actionable items affecting resident feedback quality using an NLP model. Attending surgeons are the most influential factor in whether feedback is high quality. Faculty should be directly engaged in efforts to improve the overall quality of feedback that residents receive.
------------------------
File: 2022-12-20-Teaching-AI.md
Creation Date: "Fri, 27 Feb 2026 19:13:30 +0000"
---
title: "Teaching AI as a Fundamental Toolset of Medicine"
categories:
- Blog
- Research
tags:
- Blog
- Research
- medical education
- medical school
- artificial intelligence
- machine learning
header:
teaser: "/assets/images/insta/IMG_0440.JPG"
overlay_image: "/assets/images/insta/IMG_0440.JPG"
---
New article out in Cell Reports Medicine. It is a [perspective paper on incorporating AI into medical education](https://doi.org/10.1016/j.xcrm.2022.100824) with Drs. Cornelius A. James, Kimberly D. Lomis, and James Woolliscroft.
[Download paper.](https://eotles.com/assets/papers/teaching_AI_as_a_fundamental_toolset_of_medicine.pdf)
## Abstract
Artificial intelligence (AI) is transforming the practice of medicine. Systems assessing chest radiographs, pathology slides, and early warning systems embedded in electronic health records (EHRs) are becoming ubiquitous in medical practice. Despite this, medical students have minimal exposure to the concepts necessary to utilize and evaluate AI systems, leaving them under prepared for future clinical practice. We must work quickly to bolster undergraduate medical education around AI to remedy this. In this commentary, we propose that medical educators treat AI as a critical component of medical practice that is introduced early and integrated with the other core components of medical school curricula. Equipping graduating medical students with this knowledge will ensure they have the skills to solve challenges arising at the confluence of AI and medicine.
------------------------
File: 2023-01-12-STAT-News-medical-schools-missing-mark-on-AI.md
Creation Date: "Fri, 27 Feb 2026 19:13:30 +0000"
---
title: "STAT News: How medical schools are missing the mark on artificial intelligence"
categories:
- Blog
- Press
tags:
- Blog
- Press
- artificial intelligence
- machine learning
- medical education
- medical school
- STAT News
header:
teaser: "/assets/images/insta/IMG_0388.JPG"
overlay_image: "/assets/images/insta/IMG_0388.JPG"
---
Discussed my recent [perspective paper on incorporating AI into medical education](https://www.sciencedirect.com/science/article/pii/S2666379122003834) with Dr. James Woolliscroft and Katie Palmer of STAT News. Check out the full discussion [here](https://www.statnews.com/2023/01/12/medical-school-artificial-intelligence-health-curriculum/).
------------------------
File: 2023-02-22-RISE-VTC-AI-MedEd.md
Creation Date: "Fri, 27 Feb 2026 19:13:30 +0000"
---
title: "RISE Virtual Talking Circle: Innovations in Machine Learning and Artificial Intelligence for Application in Education"
categories:
- Blog
- Talk
tags:
- medicine
- machine learning
- artificial intelligence
- medical educcation
header:
teaser: "/assets/images/insta/IMG_0302.JPG"
overlay_image: "/assets/images/insta/IMG_0302.JPG"
---
University of Michigan Medical School RISE (Research. Innovation. Scholarship. Education) virtual talking circle discussion with Dr. Cornelius James.
Discussed the need for integration of AI education into undergraduate medical education (medical school). Echoed some of the findings from our [Cell Reports Medicine paper](https://www.sciencedirect.com/science/article/pii/S2666379122003834).
[Link to presentation.](https://eotles.com/assets/presentations/2023_RISE_VTC/AI_RISE_VTC.pdf)
------------------------
File: 2023-03-16-NAM-AI-HPE.md
Creation Date: "Fri, 27 Feb 2026 19:13:30 +0000"
---
title: "National Academy of Medicine: AI in Health Professions Education Workshop"
categories:
- Blog
- Talk
tags:
- medicine
- machine learning
- artificial intelligence
- medical education
- national academies
header:
teaser: "/assets/images/insta/IMG_0212.JPG"
overlay_image: "/assets/images/insta/IMG_0212.JPG"
---
Panel discussion on AI in health professions education.
I joined a panel of learners to share our perspectives on how AI should be incorporated into health professions education. Moderated by Mollie Hobensack and Dr. Cornelius James.
Panelists included: Noahlana Monzon, CPMA Nutrition Student, University of Oklahoma, Dallas Peoples, PhD Candidate in Sociology, Texas Woman's University, Winston Guo, MD Candidate, Weill Cornell Medical College, Gabrielle Robinson, PhD Student in Medical Clinical Psychology, Uniformed Services, University of the Health Sciences, Alonzo D. Turner, PhD Student, Counseling and Counselor Education, Syracuse University & 2022 NBCC Doctoral Minority Fellow and myself.
------------------------
File: 2023-03-23-html-svg-experiments.md
Creation Date: "Fri, 27 Feb 2026 19:13:30 +0000"
---
title: HTML/SVG Experiment
categories:
- Blog
tags:
- Blog
- HTML
- SVG
header:
teaser: "/assets/images/random_gradient_hello.svg"
overlay_image: "/assets/images/random_gradient_hello.svg"
---
 Based on a [tutorial by Nikola Đuza](https://pragmaticpineapple.com/adding-custom-html-and-css-to-github-readme/).
------------------------
File: 2023-04-19-Collaborative-for-HFE-AI-Overview.md
Creation Date: "Fri, 27 Feb 2026 19:13:30 +0000"
---
title: "Collaborative for Human Factors, Cognitive Load, and Well-being: AI Overview"
categories:
- Blog
- Talk
tags:
- medicine
- machine learning
- artificial intelligence
- human factors engineering
- industrial engineering
- health systems engineering
- chatGPT
header:
teaser: "/assets/images/insta/IMG_0045.JPG"
overlay_image: "/assets/images/insta/IMG_0045.JPG"
excerpt: "Collaborative for Human Factors discussion on artificial intelligence, ChatGPT, and applicable research."
---
I covered foundational information about AI, its use in other domains, and potential and its perils in medicine. The rapid uptake of AI motivates an [argument for increased AI training in medical school and interprofessional education between engineers and physicians](https://www.sciencedirect.com/science/article/pii/S2666379122003834).
Additionally briefly discussed how [ChatGPT](https://chat.openai.com) functions and its potential limitations.
The recording was made after the presentation so that collaborative members could refer to it again.
## Recording
## Slides
[Link to presentation.](https://eotles.com/assets/presentations/2023_Collaborative_for_Human_Factors/20230418_AI_Overview.pdf)
------------------------
File: 2023-05-01-Hello-World-2.md
Creation Date: "Fri, 27 Feb 2026 19:13:30 +0000"
---
title: "Hello, World! 2.0"
categories:
- Blog
tags:
- blog
- software development
- web development
- blog
- chatGPT
- generative AI
- artificial intelligenc
header:
teaser: "/assets/images/insta/IMG_0289.JPG"
overlay_image: "/assets/images/insta/IMG_0289.JPG"
excerpt: "New blog, who dis?"
---
NB: this post was written by ChatGPT.
If you've been a regular reader of my blog, you might have noticed some changes around here recently. Don't worry, it's not just you! I've updated my blog to a new platform, something that's been a journey of exploration, experimentation, and ultimately, satisfaction.
Let's rewind a bit. The world of blogging platforms is vast and varied, each with its unique strengths and challenges. My goal was to find a platform that aligned with my specific needs. These were:
1. Writing posts in Markdown: As a fan of simplicity and efficiency, I wanted a platform that supported writing posts in Markdown. It's an easy-to-use syntax that streamlines the writing process and keeps the focus on the content, not the formatting.
2. Automated blog and page creation: While I appreciate the beauty of raw HTML and CSS, I wanted a platform that took care of the heavy lifting so I could focus on what I love - writing and engaging with all of you.
3. Platform independence: I didn't want my content to be locked into a specific platform. The ability to change the site in the future, if need be, was important to me.
4. Hassle-free hosting: To avoid dealing with the headaches of security and updating, I wanted a platform that didn't require me to manage my own hosting.
In my search, I tried out [Ghost](https://ghost.org), a sleek and visually appealing platform. While it was beautiful to look at, I found it to be fairly restrictive for my needs. I also experimented with [Squarespace](https://www.squarespace.com) and [Wix](https://www.wix.com), popular choices in the blogging world. However, they too fell short of my specific requirements.
After much exploration, I finally found a match in the combination of a [Jekyll blog](https://jekyllrb.com) with a [Minimal Mistakes theme](https://mmistakes.github.io/minimal-mistakes/), all hosted as a [GitHub Pages page](https://pages.github.com). It's the Goldilocks of blogging platforms for me - just right.
Jekyll, a simple, blog-aware, static site generator, checked all my boxes. It supports Markdown, automates blog and page creation, and isn't tied to a specific platform. The Minimal Mistakes theme added a layer of elegance and readability to the mix, aligning with my preference for a clean and minimalistic design. Hosting the blog as a GitHub page took care of the hosting concerns, providing a secure and updated environment for my blog.
Transitioning my old blog to this new tech stack was a learning experience, but the result has been rewarding. I'm excited about this new chapter and look forward to continuing to share my thoughts, experiences, and insights with you all.
Post script, by Erkin: I used [OpenAI's web-enabled ChatGPT4](https://chat.openai.com/?model=gpt-4-browsing) to generate this post. It first scraped my existing blog posts and then wrote the above post. Overall, I think it did a fairly good job of capturing my "conversational, detailed, and engaging" tone. I used the following prompt to generate the post:
> could you help me write a new blog post for my blog? first review some of my blog posts at https://eotles.com/blog/
>
> then write a post about my updated blog. the focus should be on the technical choice of platform. I chose to use a Minimal-Mistakes themed (https://mmistakes.github.io/minimal-mistakes/) Jekyll blog (https://jekyllrb.com) hosted as a GitHub page. I conducted a fairly exhaustive search of different blogging platforms and came to this combination as it met my requirements which where:
> 1. writing posts in markdown
> 2. automated blog and page creation - didn't want to have to write raw html or css
> 3. not having content locked into a specific platform - wanted to be able to change the site in the future - if need be
> 4. not having to deal with my own hosting - avoiding security and updating headaches
>
> I tried https://ghost.org which was very pretty but was fairly restrictive and I tried square space and wix. Eventually I settled on this tech stack and converted my old blog to this one
------------------------
File: 2023-07-22-Updating-Clinical-Risk-Stratification-Models-Using-Rank-Based-Compatibility.md
Creation Date: "Fri, 27 Feb 2026 19:13:30 +0000"
---
title: "Updating Clinical Risk Stratification Models Using Rank-Based Compatibility"
categories:
- Blog
- Research
tags:
- Blog
- Research
- early warning system
- medicine
- healthcare
- artificial intelligence
- machine learning
- updating
- Anthropic
header:
teaser: "/assets/images/insta/6D2D87B6-7406-43F5-A6B9-FC06FCFEED36.jpg"
overlay_image: "/assets/images/insta/6D2D87B6-7406-43F5-A6B9-FC06FCFEED36.jpg"
excerpt: "As machine learning models become more integrated into clinical care, how can we update them without violating user expectations? We proposed a new rank-based compatibility measure and loss function to develop clinical AI that better aligns with physician mental models. High rank-based compatibility is not guaranteed but can be achieved through optimization, our approach yields updated models that better meet user expectations, promoting clinician-model team performance."
---
Check out our new paper: [Updating Clinical Risk Stratification Models Using Rank-Based Compatibility: Approaches for Evaluating and Optimizing Joint Clinician-Model Team Performance](https://www.mlforhc.org/s/ID103_Research-Paper_2023.pdf).
It was accepted to the 2023 [Machine Learning for Healthcare Conference](https://www.mlforhc.org/#).
[Download paper.](https://eotles.com/assets/papers/2023_MLHC_rank_based_compatibility.pdf)
Based on a [tutorial by Nikola Đuza](https://pragmaticpineapple.com/adding-custom-html-and-css-to-github-readme/).
------------------------
File: 2023-04-19-Collaborative-for-HFE-AI-Overview.md
Creation Date: "Fri, 27 Feb 2026 19:13:30 +0000"
---
title: "Collaborative for Human Factors, Cognitive Load, and Well-being: AI Overview"
categories:
- Blog
- Talk
tags:
- medicine
- machine learning
- artificial intelligence
- human factors engineering
- industrial engineering
- health systems engineering
- chatGPT
header:
teaser: "/assets/images/insta/IMG_0045.JPG"
overlay_image: "/assets/images/insta/IMG_0045.JPG"
excerpt: "Collaborative for Human Factors discussion on artificial intelligence, ChatGPT, and applicable research."
---
I covered foundational information about AI, its use in other domains, and potential and its perils in medicine. The rapid uptake of AI motivates an [argument for increased AI training in medical school and interprofessional education between engineers and physicians](https://www.sciencedirect.com/science/article/pii/S2666379122003834).
Additionally briefly discussed how [ChatGPT](https://chat.openai.com) functions and its potential limitations.
The recording was made after the presentation so that collaborative members could refer to it again.
## Recording
## Slides
[Link to presentation.](https://eotles.com/assets/presentations/2023_Collaborative_for_Human_Factors/20230418_AI_Overview.pdf)
------------------------
File: 2023-05-01-Hello-World-2.md
Creation Date: "Fri, 27 Feb 2026 19:13:30 +0000"
---
title: "Hello, World! 2.0"
categories:
- Blog
tags:
- blog
- software development
- web development
- blog
- chatGPT
- generative AI
- artificial intelligenc
header:
teaser: "/assets/images/insta/IMG_0289.JPG"
overlay_image: "/assets/images/insta/IMG_0289.JPG"
excerpt: "New blog, who dis?"
---
NB: this post was written by ChatGPT.
If you've been a regular reader of my blog, you might have noticed some changes around here recently. Don't worry, it's not just you! I've updated my blog to a new platform, something that's been a journey of exploration, experimentation, and ultimately, satisfaction.
Let's rewind a bit. The world of blogging platforms is vast and varied, each with its unique strengths and challenges. My goal was to find a platform that aligned with my specific needs. These were:
1. Writing posts in Markdown: As a fan of simplicity and efficiency, I wanted a platform that supported writing posts in Markdown. It's an easy-to-use syntax that streamlines the writing process and keeps the focus on the content, not the formatting.
2. Automated blog and page creation: While I appreciate the beauty of raw HTML and CSS, I wanted a platform that took care of the heavy lifting so I could focus on what I love - writing and engaging with all of you.
3. Platform independence: I didn't want my content to be locked into a specific platform. The ability to change the site in the future, if need be, was important to me.
4. Hassle-free hosting: To avoid dealing with the headaches of security and updating, I wanted a platform that didn't require me to manage my own hosting.
In my search, I tried out [Ghost](https://ghost.org), a sleek and visually appealing platform. While it was beautiful to look at, I found it to be fairly restrictive for my needs. I also experimented with [Squarespace](https://www.squarespace.com) and [Wix](https://www.wix.com), popular choices in the blogging world. However, they too fell short of my specific requirements.
After much exploration, I finally found a match in the combination of a [Jekyll blog](https://jekyllrb.com) with a [Minimal Mistakes theme](https://mmistakes.github.io/minimal-mistakes/), all hosted as a [GitHub Pages page](https://pages.github.com). It's the Goldilocks of blogging platforms for me - just right.
Jekyll, a simple, blog-aware, static site generator, checked all my boxes. It supports Markdown, automates blog and page creation, and isn't tied to a specific platform. The Minimal Mistakes theme added a layer of elegance and readability to the mix, aligning with my preference for a clean and minimalistic design. Hosting the blog as a GitHub page took care of the hosting concerns, providing a secure and updated environment for my blog.
Transitioning my old blog to this new tech stack was a learning experience, but the result has been rewarding. I'm excited about this new chapter and look forward to continuing to share my thoughts, experiences, and insights with you all.
Post script, by Erkin: I used [OpenAI's web-enabled ChatGPT4](https://chat.openai.com/?model=gpt-4-browsing) to generate this post. It first scraped my existing blog posts and then wrote the above post. Overall, I think it did a fairly good job of capturing my "conversational, detailed, and engaging" tone. I used the following prompt to generate the post:
> could you help me write a new blog post for my blog? first review some of my blog posts at https://eotles.com/blog/
>
> then write a post about my updated blog. the focus should be on the technical choice of platform. I chose to use a Minimal-Mistakes themed (https://mmistakes.github.io/minimal-mistakes/) Jekyll blog (https://jekyllrb.com) hosted as a GitHub page. I conducted a fairly exhaustive search of different blogging platforms and came to this combination as it met my requirements which where:
> 1. writing posts in markdown
> 2. automated blog and page creation - didn't want to have to write raw html or css
> 3. not having content locked into a specific platform - wanted to be able to change the site in the future - if need be
> 4. not having to deal with my own hosting - avoiding security and updating headaches
>
> I tried https://ghost.org which was very pretty but was fairly restrictive and I tried square space and wix. Eventually I settled on this tech stack and converted my old blog to this one
------------------------
File: 2023-07-22-Updating-Clinical-Risk-Stratification-Models-Using-Rank-Based-Compatibility.md
Creation Date: "Fri, 27 Feb 2026 19:13:30 +0000"
---
title: "Updating Clinical Risk Stratification Models Using Rank-Based Compatibility"
categories:
- Blog
- Research
tags:
- Blog
- Research
- early warning system
- medicine
- healthcare
- artificial intelligence
- machine learning
- updating
- Anthropic
header:
teaser: "/assets/images/insta/6D2D87B6-7406-43F5-A6B9-FC06FCFEED36.jpg"
overlay_image: "/assets/images/insta/6D2D87B6-7406-43F5-A6B9-FC06FCFEED36.jpg"
excerpt: "As machine learning models become more integrated into clinical care, how can we update them without violating user expectations? We proposed a new rank-based compatibility measure and loss function to develop clinical AI that better aligns with physician mental models. High rank-based compatibility is not guaranteed but can be achieved through optimization, our approach yields updated models that better meet user expectations, promoting clinician-model team performance."
---
Check out our new paper: [Updating Clinical Risk Stratification Models Using Rank-Based Compatibility: Approaches for Evaluating and Optimizing Joint Clinician-Model Team Performance](https://www.mlforhc.org/s/ID103_Research-Paper_2023.pdf).
It was accepted to the 2023 [Machine Learning for Healthcare Conference](https://www.mlforhc.org/#).
[Download paper.](https://eotles.com/assets/papers/2023_MLHC_rank_based_compatibility.pdf) [Paper on arXiv.](https://arxiv.org/abs/2308.05619) Code for the new measure, loss function, and experimental analysis can be found at [this GitHub repo](https://github.com/eotles/MLHC_2023_rank_based_compatibility_supplemental_code). ## Abstract As data shift or new data become available, updating clinical machine learning models may be necessary to maintain or improve performance over time. However, updating a model can introduce compatibility issues when the behavior of the updated model does not align with user expectations, resulting in poor user-model team performance. Existing compatibility measures depend on model decision thresholds, limiting their applicability in settings where models are used to generate rankings based on estimated risk. To address this limitation, we propose a novel rank-based compatibility measure, $$C^R$$, and a new loss function that optimizes discriminative performance while encouraging good compatibility. Applied to a case study in mortality risk stratification leveraging data from MIMIC, our approach yields more compatible models while maintaining discriminative performance compared to existing model selection techniques, with an increase in $$C^R$$ of $$0.019$$ ($$95\%$$ confidence interval: $$0.005$$, $$0.035$$). This work provides new tools to analyze and update risk stratification models used in settings where rankings inform clinical care. Here's a 30,000 foot summary of the paper. ## Updating Clinical Risk Models While Maintaining User Trust As machine learning models become more integrated into clinical care, it's crucial we understand how updating these models impacts end users. Models may need to be retrained on new data to maintain predictive performance. But if updated models behave differently than expected, it could negatively impact how clinicians use them. My doctoral advisors (Dr. Brian T. Denton and Dr. Jenna Wiens) and I recently explored this challenge of updating for clinical risk stratification models. These models estimate a patient's risk of some outcome, like mortality or sepsis. They're used to identify high-risk patients who may need intervention. ### Backwards Trust Compatibility An existing compatibility measure is [backwards trust compatibility (developed by Bansal et al.)](https://ojs.aaai.org/index.php/AAAI/article/view/4087). It checks if the original and updated models label patients correctly in the same way. But it depends on setting a decision "threshold" to convert risk scores into labels. In many clinical settings, like ICUs, physicians may use risk scores directly without thresholds. So we wanted a compatibility measure that works for continuous risk estimates, not just thresholded labels. ### Rank-Based Compatibility We introduced a new rank-based compatibility measure. It doesn't require thresholds. Instead, it checks if the updated model ranks patients in the same order as the original model. For example, if the original model ranked patient A's risk higher than patient B, does the updated model preserve this ordering? The more patient pair orderings it preserves, the higher its rank-based compatibility. ### Training Models to Prioritize Compatibility But simply measuring compatibility isn't enough - we want to optimize it during model training. So we proposed a new loss function that balances predictive performance with rank-based compatibility. Using a mortality prediction dataset, we compared models trained normally vs with our compatibility-aware loss function. The optimized models achieved significantly better compatibility without sacrificing much accuracy. ### Why This Matters Model updating is inevitable as new data emerge. But unintended changes in model behavior can violate user expectations. By considering compatibility explicitly, we can develop clinical AI that better aligns with physician mental models. This helps ensure updated models are readily adopted, instead of met with skepticism. It's a small but important step as we integrate machine learning into high-stakes medical settings. We're excited to continue improving these models collaboratively with end users. Please let me know if you have any questions. Cheers,
Erkin
[Go ÖN Home](https://eotles.com) N.B. this blog post was writen in collaboration with [Anthropic's Claude](https://www.anthropic.com). ------------------------ File: 2023-07-22-qr-code-generator.md Creation Date: "Fri, 27 Feb 2026 19:13:30 +0000" --- title: "QR Code Generator" categories: - Blog tags: - Blog - QR Code - javascript --- A simple QR code generator that you can use to make QR code embeded with the strings of your dreams! I made this for a series of presentations I gave. It enabled me to make a QR code quickly from a URL (usually from this site) without having to google and find a website to do this. I had ChatGPT write up the javascript, which was pretty slick. Note. This tool is entirely for me. If you get use out of it too, nice!
Hangman Game
Incorrect guesses:
------------------------ File: 2023-08-11-Machine-Learning-for-Healthcare-2023.md Creation Date: "Fri, 27 Feb 2026 19:13:30 +0000" --- title: "2023 Machine Learning for Healthcare Conference" categories: - Blog - Talk tags: - Machine Learning for Healthcare Conference - medicine - healthcare - research - machine learning - artificial intelligence header: teaser: "/assets/images/insta/E35BD8D3-0BE7-4D05-BDD7-C42C47F7C487.jpg" overlay_image: "/assets/images/insta/E35BD8D3-0BE7-4D05-BDD7-C42C47F7C487.jpg" --- Presentation at Machine Learning for Healthcare 2023 in New York on our work on rank-based compatibility. During the conference I presented a brief spotlight talk introducing our work and also had the chance to present a poster going into more detail. I've included copies of both in this blog post. You can find a link to the post about the paper [here](https://eotles.com/blog/research/Updating-Clinical-Risk-Stratification-Models-Using-Rank-Based-Compatibility/). A recording of the spotlight intro video. Spotlight presentation slides [Link to download presentation.](https://eotles.com/assets/presentations/2023_MLHC/20230811_MLHC_rank_based_compatibility.pdf) Poster [Link to download poster.](https://eotles.com/assets/presentations/2023_MLHC/2023_MLHC_poster_20230809.pdf) ## Abstract Updating clinical machine learning models is necessary to maintain performance, but may cause compatibility issues, affecting user-model interaction. Current compatibility measures have limitations, especially where models generate risk-based rankings. We propose a new rank-based compatibility measure and loss function that optimizes discriminative performance while promoting good compatibility. We applied this to a mortality risk stratification study using MIMIC data, resulting in more compatible models while maintaining performance. These techniques provide new approaches for updating risk stratification models in clinical settings. ------------------------ File: 2023-09-12-Github-Action-for-Post-Concatenation.md Creation Date: "Fri, 27 Feb 2026 19:13:30 +0000" --- title: "It's Automation All the Way Down! How to Use GitHub Actions for Blogging Automation with LLMs" last_modified_at: 2023-12-08 categories: - Blog tags: - git - github - github actions - github pages - CI/CD - blogging - jekyll - minimal mistakes - minimal-mistakes - automation tools - web development - workflow optimization - LLM - chatGPT - data engineering header: teaser: "/assets/images/insta/IMG_2253.JPG" overlay_image: "/assets/images/insta/IMG_2253.JPG" overlay_filter: 0.5 # same as adding an opacity of 0.5 to a black background excerpt: "CI/CD automation isn't just for large-scale projects; it's a game-changer for individual programmers. I've started using the power of GitHub Actions to improve my blogging process, making it more efficient. I ❤️ Automation." --- # The LLM Advantage in Blogging I've used [large language model (LLM)](https://en.wikipedia.org/wiki/Large_language_model) powered chatbots ([ChatGPT](https://chat.openai.com) & [Claude](https://claude.ai/chats) to help with some of my writing. They've been especially beneficial with blog posts where I have functionality dependent on JavaScript code. # The Automation Dilemma Utilizing these LLM chatbots is pretty straightforward, but it gets annoying when you want to provide them with writing samples. You can pick and choose a couple representative posts and share those, but that's too scattershot for me. Ideally, I'd like my whole corpus of blog posts to be used as samples for the chatbots to draw from. I had written some python scripts that loop over my posts and create a concatenated file. This worked fine for creating a file - but it was annoying to manually kick off the process every time I made a new post. So, I started thinking about how to automate the process. There are many ways to approach it, but I wanted to keep it simple. The most straightforward route was to build off my existing automation infrastructure - the GitHub pages build process. # GitHub Actions: My Automation Hero The GitHub pages build process automatically converts the documents I use to write my blog (markdown files) into the web pages you see (HTML). GitHub provides this service as a tool for developers to quickly spin up webpages using the [GitHub Actions](https://github.com/features/actions) framework. GitHub actions are fantastic as they enable [continuous integration and continuous delivery/deployment (CI/CD)](https://en.wikipedia.org/wiki/CI/CD).
    graph TB

    %% Primary Path
    A[Push new blog .md post to github] --> BA
    BB --> CA
    CB --> D[Commit & push changes]

    %% GitHub Pages Build Process
    subgraph B[GitHub Pages Build Process]
        BA[Build eotles.com webpages] --> BB[Trigger: gh-pages branch]
    end

    %% Concatenate .md Files Action
    subgraph C[Concatenate .md Files Action]
        CA[Create file] --> CB[Loop over all posts and concat to file]
    end

    %% .md Files
    A -.-> P[.md files]
    P -.-> B
    P -.-> C
*The above diagram provides a visual overview of the automation process I've set up using GitHub Actions.*
# Connecting the Dots with Jekyll, GitHub Pages, and Minimal Mistakes Theme
We've primarily centered our dicussion of automation around GitHub Actions; however, it's essential to recognize [the broader ecosystem that supports my blogging](/blog/Hello-World-2/). I use the [Jekyll blogging platform](https://jekyllrb.com), a simple, blog-aware, static site generator. It's a fantastic tool that allows me to write in Markdown (.md), keeping things straightforward and focused on content. And Jekyll seamlessly integrates with GitHub Pages! The aesthetic and design of my blog is courtesy of the [Minimal Mistakes theme](https://mmistakes.github.io/minimal-mistakes/). It's a relatively flexible theme for Jekyll that's ideal for building personal portfolio sites.
For those of you who are on the Jekyll-GitHub Pages-Minimal Mistakes trio, the automation process I've described using GitHub Actions can be a game-changer. It's not just about streamlining; it's about harnessing the full potential of these interconnected tools to actually *speed up* your work.
# Diving into CI/CD
CI/CD is essential if you regularly ship production code. For example, it enables you to automatically kick off testing code as a part of your code deployment process. This is really important when you are working on a large codebase as a part of a team. Fortunately/unfortunately, I'm in the research business, so I'm usually just coding stuff up by my lonesome. CI/CD isn't a regular part of my development process (although maybe it should be 🤔). Despite not using it before, I decided to see if I could get it to work for my purposes.
# My First Foray into GitHub Action
Since this was my first time with GitHub Actions, I turned to an expert, ChatGPT. I had initially asked it to make a bash script that I was going to run manually, but then I wondered:
> so I have a website I host on GitHub. Is there a way to use the GitHub actions to automatically concantenate all the .md files in the /_posts directory?
It described the process, which comprised of two steps:
1. Create a GitHub Action Workflow: you tell GitHub about an action by creating a YAML file in a special subdirectory (`.github/workflows`) of the project
2. Define the Workflow: in the YAML file, specify what you want to happen.
ChatGPT suggested some code to put in this file.
I committed and pushed the changes. A couple minutes later, I got an email that my GitHub Action(s) had errored out. The action that I created conflicted with the existing website creation actions. With assistance from ChatGPT, I solved this by having my new concatenation action wait for the website creation action to finish before running. We achieved this by using the gh-pages branch as a trigger, ensuring our action ran after the webpages were built and deployed.
# The Code Behind the Magic
The code for this GitHub Action is as follows:
```
name: Concatenate MD Files with Metadata
on:
push:
paths:
- '_posts/*.md'
jobs:
build:
runs-on: ubuntu-latest
steps:
- name: Checkout repository
uses: actions/checkout@v2
- name: Concatenate .md files with metadata
run: |
mkdir -p workflows_output
> workflows_output/concatenated_posts.md
cd _posts
for file in *.md; do
echo "File: $file" >> ../workflows_output/concatenated_posts.md
echo "Creation Date: $(git log --format=\"%aD\" -n 1 -- $file)" >> ../workflows_output/concatenated_posts.md
cat "$file" >> ../workflows_output/concatenated_posts.md
echo "------------------------" >> ../workflows_output/concatenated_posts.md
done
- name: Commit and push if there are changes
run: |
git config --local user.email "action@github.com"
git config --local user.name "GitHub Action"
git add -A
git diff --quiet && git diff --staged --quiet || git commit -m "Concatenated .md files with metadata"
git push
```
# Conclusion: Automation Can Be a Warm Hug
The final result was an automation process that runs in the background every time a new post is added. Overall, I was impressed with the power and flexibility of GitHub Actions. This experience demonstrated that CI/CD isn't just for large software projects but can be a valuable tool for individual researchers and developers!
# Update!
This automation didn't end up working well.
I ended up switching the automation trigger to be time-based.
You can read about the updated setup [here](/blog/Github-Action-for-Post-Concatenation-Update/).
Cheers, Erkin
[Go ÖN Home](https://eotles.com) ## PS The mermaid diagram (the flow diagram) was embedded thanks to a [post from Ed Griebel](http://edgriebel.com/2019-embedding-mermaid-diagram/). ## PS The embedding code didn't seem to like subgraphs, now using [HTML provided by Mermaid](https://mermaid.js.org/config/usage.html#simple-full-example). ------------------------ File: 2023-09-14-IAMSE-AI.md Creation Date: "Fri, 27 Feb 2026 19:13:30 +0000" --- title: "IAMSE Artificial Intelligence: Preparing for the Next Paradigm Shift in Medical Education" categories: - Blog - Talk tags: - medicine - machine learning - artificial intelligence - medical educcation header: teaser: "/assets/images/insta/IMG_0620.JPG" overlay_image: "/assets/images/insta/IMG_0620.JPG" overlay_filter: 0.5 # same as adding an opacity of 0.5 to a black background --- Joined the International Association of Medical Science Educators (IAMSE) for 2023 webinar series on artificial intelligence in medical education. Dr. Cornelius James and I presented our perspectives on AI and med ed in our talk titled: "Preparing for the Next Paradigm Shift in Medical Education." We stress the need for integration of AI education into undergraduate medical education (medical school), echoing some of the findings from our [Cell Reports Medicine paper](https://www.sciencedirect.com/science/article/pii/S2666379122003834). [Link to presentation.](https://eotles.com/assets/presentations/2023_IAMSE/20230914_IAMSE.pdf) ------------------------ File: 2023-09-20-Toki-Conference-Timer.md Creation Date: "Fri, 27 Feb 2026 19:13:30 +0000" --- title: "Toki Conference Timer" last_modified_at: 2023-09-21 categories: - Blog - Project tags: - iOS - swift - conference - timer header: teaser: "/assets/images/insta/IMG_2184.JPG" overlay_image: "/assets/images/insta/IMG_2184.JPG" overlay_filter: 0.5 # same as adding an opacity of 0.5 to a black background excerpt: "Perfect Timing for Talks!" layout: single author_profile: false read_time: false related: false --- # Toki the Conference Timer App Introducing Toki a conference timer application that is the perfect companion for conference organizers and speakers!  ## Features - **Two Timers**: Seamlessly toggle between talk duration and QA session. - **Visual Alerts**: As talk time dwindles, the background color shifts from green to red, providing a clear and immediate visual cue. - **Easy Legibility**: Designed to make time easily visible for speakers from a distance. ## Getting Started 1. **Download the App**: Available now on the [App Store](https://apps.apple.com/app/toki-conference-timer/id6467174937). 2. **Set the Times**: Input your desired times for the talk and QA session. 3. **Start the Timer**: Tap to start the timer for the talk. Once the talk is over, toggle to the QA timer with just a touch. 4. **Stay Alerted**: The changing background color will keep speakers informed of their remaining time. ## FAQs **Q**: How do I toggle between the two timers? **A**: Simply tap the toggle button on the top of the app screen to switch between talk and QA mode. **Q**: Can I customize the color gradient? **A**: Currently, the color shift is from green to red as the time elapses. I'll consider adding customization options in future updates! **Q**: Is there an Android version available? **A**: At this moment, the app is exclusively available for iOS devices. ## Support Experiencing issues? Have suggestions? I'm all ears. - **Email**: [hi@eotles.com](mailto:hi@eotles.com?subject=TOKI) - **Twitter**: [@eotles](https://twitter.com/eotles) ## Updates Stay updated with our latest features and improvements by checking this page or following me on [Twitter](https://twitter.com/eotles). ## Privacy Policy [We don't collect any data.](https://eotles.com/assets/post_assets/2023-Toki/20230920_privacy_policy.pdf) --- Toki Conference Timer App © 2023 Erkin Ötleş. All rights reserved. ------------------------ File: 2023-09-22-Testing-IFrame-Embedding.md Creation Date: "Fri, 27 Feb 2026 19:13:30 +0000" --- title: "Iframe Embedding: Why and How" last_modified_at: 2023-09-25 categories: - Blog tags: - iframe - html - blogging - jekyll - minimal mistakes - minimal-mistakes - web development header: teaser: "/assets/images/insta/IMG_0015.JPG" overlay_image: "/assets/images/insta/IMG_0015.JPG" overlay_filter: 0.5 # same as adding an opacity of 0.5 to a black background excerpt: "Exploring the motivation behind using iframes OR how to seamlessly integrate the internet into your blog." --- # Iframe Embedding: Serving External Content Seamlessly Embedding content has been a staple of web development for quite some time. The ` The integration from the reader's perspective is pretty seamless Luckily, the process is also straightforward from the writer’s perspective. Here's the code we used to embed the Wikipedia homepage: ```html ``` # Why Use Iframes? The main advantage of iframes is their ability to separate distinct pieces of content or functionality. For instance, when creating a blog post that features an interactive visualization, you might find it challenging to blend the visualization code with your writing seamlessly. The code might be extensive, or you may want the flexibility to update the visualization without modifying the main content of your post. Consider this [Airline Merger Visualization](https://eotles.com/blog/Airline-Merger-Visualization/) blog post for an illustrative example. The main blog content discusses creating the viz, and the viz itself is housed on a [separate page](http://eotles.com/AirlineMergers/visualizations/20230922_airlineMergers.html). Rather than requiring readers to jump between two links, the content from the separate page was embedded directly into the main post using an iframe. This offers a cohesive reading experience without sacrificing the richness of the interactive content. Cheers,
Erkin
[Go ÖN Home](https://eotles.com) ------------------------ File: 2023-09-25-Airline-Merger-Visualization.md Creation Date: "Fri, 27 Feb 2026 19:13:30 +0000" --- title: "Airline Merger Data Visualization" categories: - Blog tags: - data visualization - data engineering - web development - javascript - d3.js - ChatGPT - airlines - business - mergers header: teaser: "/assets/images/insta/6325DB28-15F8-4D9A-85A4-CE263339C806_1_105_c.jpeg" overlay_image: "/assets/images/insta/6325DB28-15F8-4D9A-85A4-CE263339C806_1_105_c.jpeg" overlay_filter: 0.5 # same as adding an opacity of 0.5 to a black background excerpt: "Analyzing how airlines have come and gone over the past century." --- # A Visualization of Airline Mergers I recently embarked on a project to visualize airline mergers in the US using the [D3.js data visualization library](https://d3js.org). My initial goal was simple - have ChatGPT help me generate a timeline view of major US airlines and their merger relationships over the decades. I thought it would be pretty straightforward, as I've had a lot of success using ChatGPT to [generate JavaScript for other projects](https://eotles.com/tags/#javascript) and even make [iOS applications](https://eotles.com/blog/project/Toki-Conference-Timer/). In my head, the task was simple: create a JavaScript visualization with the following characteristics: * Time is on the vertical axis, progressing as you scroll down. * Each airline is plotted as a line, starting on their foundation/initial operations date. * Mergers or partial acquisitions should be depicted as horizontal lines between two (or more) airlines' lines. Simple, no? Well, it was not. But before we get into the problems, let's look at the end product. As I alluded to earlier, this project could have been more straightforward. The creation of the above viz was more complex and nuanced than I had initially envisioned. # Unexpected Complexity ChatGPT balked at the pretty consistently when asked to help generate the viz. This balking was surprising. Usually, with the proper prompts and chaining, I can get ChatGPT to code up something resembling my aim. However, ChatGPT kept saying the task was too complicated, even with significant coaching. It took me a while to believe ChatGPT, but I *eventually* realized that this was way more complicated of an ask than I had initially envisioned. This was because the data were a lot more complicated. Many airlines have existed over the past century, some popping in and out of existence multiple times (see [Frontier](https://en.wikipedia.org/wiki/Frontier_Airlines_(1950–1986)) and [Western](https://en.wikipedia.org/wiki/Western_Airlines)), and they often have convoluted relationships with one another. Defining what constituted an "airline" became tricky - early airmail carriers that later entered passenger service looked very different than modern airlines. I got ChatGPT to generate some starting data by limiting the timeframe (last 50 years) and airline definition (major airlines). This yielded a template that I could begin to build out manually. Additionally, the visualization wasn’t a straightforward plot and was hard to describe to ChatGPT. Initially, I wanted something like a [flow diagram](https://en.wikipedia.org/wiki/Flow_diagram) or a [Sankey plot](https://en.wikipedia.org/wiki/Sankey_diagram) to show fleet sizes over time. But this was an added level of complexity and data that wasn't feasible. I retreated on this front and used this "lane diagram" paradigm. Finally, I had ChatGPT generate about half of the data presented. As I started manually adding airlines and relationships, I had to "modify" existing data that ChatGPT had generated. Most of the time, this wasn't because ChatGPT was making up stuff, but it had interpreted a relationship or a founding date differently. Checking all the data is difficult - this is an interesting "failure mode" of using an LLM in this project. Many of the facts look right, but if you need guarantees about the accuracy, you'll need ways to double-check. And that's a manual process (look stuff up on Wikipedia) for this project. # Evolution of Aviation Despite the complexity, the end visualization effectively captured distinct eras in the evolution of US aviation. We see the early days of airlines with myriad airmail carriers, like [Varney](https://en.wikipedia.org/wiki/Varney_Air_Lines), and other small companies, like [Huff Daland Dusters](https://en.wikipedia.org/wiki/Huff-Daland). The visualization shows how these little companies were aggregated into the "Big Four" airlines (American, Eastern, TWA, and United) that dominated the industry after the [1930 Spoils Conference](https://en.wikipedia.org/wiki/Air_Mail_scandal). And it shows the proliferation of new entrants following [deregulation in 1978](https://en.wikipedia.org/wiki/Airline_Deregulation_Act). Today, the industry has consolidated down to three major legacy carriers - American, Delta, and United - all of whom can trace their history back to early airmail operators. The visualization indirectly hints at how the airline business transformed into a [significant financial](https://www.theatlantic.com/ideas/archive/2023/09/airlines-banks-mileage-programs/675374/) and logistics enterprise over the decades. The current viz encapsulates many impactful events and relationships that shaped commercial aviation. But there are still areas for improvement. # Refining the Visualization I'm not 100% done with this project, but in this spirit of "shipping" often, I've decided to release this version. However, there are several ways I want to improve this project: - Add More Airlines: The current graphic does not encompass all airlines. I could expand it to include more regional and early operators. - Enrich Data: The visualization would be more informative if each airline timeline incorporated additional data like the number of routes, fleet size, etc. - Refactor Code: I would like to refactor the viz so that the data is separated from the HTML displaying the viz. Then, it could be queried in different ways. - Improvement of Viz: Every airline has its "own lane" right now. This means that horizontal space is used suboptimally, as we could have airlines that don't overlap temporally share the same vertical space. - Autolayout: I manually tweaked the layout of the viz for aesthetic purposes. We could mathematically encode our viz constraints and design objectives and then use mathematical programming techniques to get a nice viz without any manual tinkering. - Explore New Visual Encodings: With the data extracted, I could try different visualization types like Sankey diagrams or flow charts to represent relationships. The viz code lives in a [separate HTML file](http://eotles.com/AirlineMergers/visualizations/20230922_airlineMergers.html) in a [public Airline Mergers GitHub repository](https://github.com/eotles/AirlineMergers/tree/main). I'll create new refined visualizations in that directory and post about them as soon as I have time. I'm excited to continue refining this airline merger visualization project. It was an excellent d3.js learning experience. Please let me know if you have any other ideas for improving the graphic or applying this approach more broadly! # Bonus: This Type of Viz in Medicine? I think this visual could summarize various parts of patient trajectories. For example, it relates to how anesthesia EMRs display their intra-operative infusions. But is there any way to use the "merging" functionality? Another use could be the interactive visualization of anatomical structures with branching and merging patterns, like nerves and vasculature. I might try making a version of the brachial plexus with this code. Final thoughts: you could use this to represent healthcare organization mergers. Maybe that's another project I'll start in the future. Cheers,
Erkin
[Go ÖN Home](https://eotles.com) ------------------------ File: 2023-09-28-Apple-Watch-HealthKit-VO2-Max-Analysis-Intro.md Creation Date: "Fri, 27 Feb 2026 19:13:30 +0000" --- title: "Understanding How Apple Watch Estimates VO2 Max: Introduction and Data Extraction" last_modified_at: 2023-11-11 categories: - Blog - Research tags: - apple watch - VO2 max - healthkit - data science - exploratory data analysis - machine learning - personal health records - XML header: teaser: "/assets/images/insta/IMG_1144.JPG" overlay_image: "/assets/images/insta/IMG_1144.JPG" excerpt: "Leveraging personal HealthKit data to evaluate and understand Apple's VO2 max estimation algorithm." --- # VO2 Max VO2 Max is considered one of the best measurements of cardiovascular fitness and aerobic endurance. It represents the maximum oxygen consumption rate during exercise, expressed in milliliters (of oxygen) per kilogram of body weight per minute (ml/kg/min). The higher someone's VO2 Max, the better their heart, lungs, and muscles can supply oxygen for energy production during sustained exercise. That's why VO2 Max is often used as a benchmark for fitness and performance potential in endurance athletes. [See the Wikipedia article on VO2 Max](https://en.wikipedia.org/wiki/VO2_max) for more details. However, directly measuring VO2 Max requires performing a maximal exercise test while breathing into a mask to analyze expired gases. This level of exertion is difficult for many people. That's why researchers and companies have tried to develop ways to estimate VO2 Max levels using submaximal exercise data like heart rate.
Erkin
[Go ÖN Home](https://eotles.com) ## PS There are other tools to analyze and extract HealthKit data. Here's a brief list of the alternatives I encountered while working on this project: - [Tutorial on Exporting and Parsing Apple Health Data with Python by Mark Koester](http://www.markwk.com/data-analysis-for-apple-health.html) - [Quantified Self Ledger GitHub](https://github.com/markwk/qs_ledger) ## Acknowledgements I want to thank [Emily A. Balczewski](https://www.linkedin.com/in/ebalczewski/) for reviewing this post and providing feedback on it and the project! ------------------------ File: 2023-10-11-Hyponatremia-Modeling.md Creation Date: "Fri, 27 Feb 2026 19:13:30 +0000" --- title: "Hyponatremia Modeling" categories: - Blog tags: - blogging header: teaser: "/assets/images/insta/E35BD8D3-0BE7-4D05-BDD7-C42C47F7C487.jpg" overlay_image: "/assets/images/insta/E35BD8D3-0BE7-4D05-BDD7-C42C47F7C487.jpg" --- Can we build tools to help with the algorithmic way of assessing hyponatremia? Below is a mermaid diagram from some a chalk talk that an emergency department / ICU attending gave on hyponatremia assessment.
graph TD
    A[Hyponatremia] --> B{Serum Osmolality}
    B -->|Hypertonic: >295 mOsm/kg| D[Hyperglycemia or Other Osmotic Agents]
    B -->|Isotonic: ~275-295 mOsm/kg| C[Pseudohyponatremia]
    B -->|Hypotonic: <275 mOsm/kg| E{Urine Osmolality}
    E -->|<100 mOsm/kg| F[Primary Polydipsia \n Low Solute Intake]
    E -->|>100 mOsm/kg| G{Urine Sodium}
    G -->|<20 mEq/L| H[Volume Depletion: Renal or Extrarenal Losses]
    G -->|>20 mEq/L| I[SIADH\nAdrenal Insufficiency\nHypothyroidism]
Mermaid diagram from ChatGPT
graph TD
    A[Hyponatremia] --> B{Assess volume status}

    B --> C1[Volume Depletion]
    B --> C2[Euvolemic]
    B --> C3[Volume Overload]

    C1 --> D1{Urine Sodium <20 mEq/L?}
    D1 --> E1[Extrarenal Salt Losses]
    D1 --> E2[Renal Salt Losses]

    C2 --> D2{Urine Osmolality?}
    D2 --> E3[Urine Osm <100 mOsm/kg: Primary Polydipsia]
    D2 --> E4[Urine Osm >100 mOsm/kg]

    E4 --> F1{Urine Sodium?}
    F1 --> G1[Urine Sodium <20 mEq/L: Reset Osmostat]
    F1 --> G2[Urine Sodium >20 mEq/L]

    G2 --> H1[SIADH]
    G2 --> H2[Hypothyroidism]
    G2 --> H3[Adrenal Insufficiency]

    C3 --> D3{Urine Sodium <20 mEq/L?}
    D3 --> E5[Heart Failure, Cirrhosis, Nephrosis]
    D3 --> E6[Acute/Chronic Renal Failure]
Cheers, Erkin
[Go ÖN Home](https://eotles.com) ------------------------ File: 2023-10-31-WPI-Business-Week-2023.md Creation Date: "Fri, 27 Feb 2026 19:13:30 +0000" --- title: "WPI Business Week: ML for Healthcare Talk" categories: - Blog - Talk tags: - medicine - healthcare - research - machine learning - artificial intelligence - header: teaser: "/assets/images/insta/IMG_0005.JPG" overlay_image: "/assets/images/insta/IMG_0005.JPG" overlay_filter: 0.5 # same as adding an opacity of 0.5 to a black background --- I had the distinct pleasure of joining the vibrant community at [WPI Business School](https://www.wpi.edu/academics/business) for a conversation that took us to the crossroads of technology and healthcare. It was an opportunity to dive into how engineering and business principles are increasingly interwoven with clinical practice. As a Medical Scientist Training Fellow at the University of Michigan, my work orbits around integrating Artificial Intelligence and Machine Learning (AI/ML) tools in medical practice. My talk, "Machine Learning for Healthcare: Lessons From Across The Healthcare ML Lifecycle," aimed to shed light on the technical underpinnings and the broad, non-technical implications of these advancements. The WPI Business School crafted an engaging platform with their inaugural Business Week, filled with diverse insights, from leadership lessons to hands-on sessions like "Elevate Your LinkedIn Game." It was within this rich tapestry of ideas that I presented my perspectives on AI/ML in medicine. During my talk, we navigated the nuances of developing and implementing AI/ML-based models, specifically risk stratification models, which physicians use to estimate a patient's risk of developing a particular condition or disease. These tools have existed for a long time; however, recent advances in AI/ML enable developers to make tools with greater accuracy and efficiency, potentially transforming patient outcomes. However, the journey from an initial clinical question to a model implemented into clinical workflows is fraught with challenges, including data representation, prospective performance degradation, and updating models in use by physicians. I was thrilled to see a curious and engaged audience, with participation that demonstrated WPI Business School's unique role in this space as a polytechnic institution. It's discussions like these that are critical for developing AI/ML tools that are not only innovative but also responsible and aligned with societal needs. As a token of my appreciation for this intellectual exchange, I'm sharing my slides from the talk. I hope they serve as a resource and a spark for further conversation. [Link to download presentation.](https://eotles.com/assets/presentations/2023_WPI/20231031_WPI.pdf) My key takeaway from this experience? Whether you're a developer, a business strategist, or a medical professional, staying informed and involved in the conversation about AI/ML in medicine is vital. It's at the intersection of these diverse perspectives that the most meaningful innovations are born. I extend my heartfelt thanks to Dr. Michael Dohan and WPI Business School for hosting me and orchestrating such an insightful series of events. The future of business and STEM is a collaborative one, and I look forward to the continued dialogue that events like these foster. Cheers,
Erkin
[Go ÖN Home](https://eotles.com) ------------------------ File: 2023-11-07-Apple-Watch-HealthKit-VO2-Max-Analysis-Workout-Data-Extraction.md Creation Date: "Fri, 27 Feb 2026 19:13:30 +0000" --- title: "Understanding How Apple Watch Estimates VO2 Max: Workout Data Extraction" last_modified_at: 2023-11-11 categories: - Blog - Research tags: - apple watch - VO2 max - healthkit - data science - exploratory data analysis - machine learning - personal health records - XML header: teaser: "/assets/images/insta/IMG_1144.JPG" overlay_image: "/assets/images/insta/IMG_1144.JPG" excerpt: "Continuing our journey to understand Apple's VO2 max estimation algorithm, by getting workout data." --- # Diving Into the Data We continue our quest to demystify how the Apple Watch estimates VO2 Max. Let's take the plunge into the data and prepare it for analysis. If you’re tuning in for the first time, I’d recommend checking out the [previous post](/blog/research/Apple-Watch-HealthKit-VO2-Max-Analysis-Intro/) to get up to speed. It's worth the detour. # Apple Health Export Data Thanks to the script we discussed last time, we converted the daunting `export.xml` file from HealthKit into a much friendlier `apple_health_export.csv`. Here's a link to the python script: [Apple Health ```export.xml``` to ```CSV``` Converter](https://github.com/eotles/HealthKit-Analysis/blob/main/apple_health_xml_convert.py). Note, if you've been playing along at home, your CSV may have a date suffix. Now, let's talk about the CSV itself. It's fairly large, my CSV was about 1.3GB (which isn't crazy for nearly a decade of data). Within this file, you'll find rows and rows of HealthKit entries. There are a bunch of columns, ranging from the type of data to the source, value, unit, and timestamps of creation, start, and end. (There are many other columns, but we will ignore these because they are more sparsely populated metadata.) Only some of that data pertains to VO2 Max. Stupid ChatGPT joke: > Much of it is like that gym equipment you buy with great intentions – it's there, but you're not going to use it. Here's a sneak peek at what we're dealing with: | type | sourceName | value | unit | startDate | endDate | creationDate | |----------------------|----------------------|----------|--------------|--------------------------|--------------------------|--------------------------| | VO2Max | Erkin’s Apple Watch | 45.0789 | mL/min·kg | 2020-01-08 19:59:01-04:00| 2020-01-08 19:59:01-04:00| 2020-01-08 19:59:02 -0400| | DistanceWalkingRunning | Erkin’s Apple Watch | 0.289404 | mi | 2020-01-08 19:42:40-04:00| 2020-01-08 19:47:45-04:00| 2020-04-09 07:19:11 -0400| | DistanceWalkingRunning | Erkin's iPhone 6s | 0.616122 | mi | 2020-01-08 19:46:19-04:00| 2020-01-08 19:56:19-04:00| 2020-01-08 19:57:22 -0400| | DistanceWalkingRunning | Erkin’s Apple Watch | 0.306078 | mi | 2020-01-08 19:47:45-04:00| 2020-01-08 19:52:49-04:00| 2020-04-09 07:19:11 -0400| | DistanceWalkingRunning | Erkin’s Apple Watch | 0.319039 | mi | 2020-01-08 19:52:49-04:00| 2020-01-08 19:57:53-04:00| 2020-04-09 07:19:12 -0400| | DistanceWalkingRunning | Erkin’s Apple Watch | 0.0363016| mi | 2020-01-08 19:57:53-04:00| 2020-01-08 19:58:55-04:00| 2020-04-09 07:19:12 -0400| | ActiveEnergyBurned | Erkin’s Apple Watch | 39.915 | Cal | 2020-01-08 19:42:33-04:00| 2020-01-08 19:47:37-04:00| 2020-04-09 07:19:13 -0400| So, we need a way to extract only the data related to workouts. HealthKit is robust, and I'm sure that if I were doing this directly as part of an iOS application, I could use some of Apple's APIs ([like this](https://developer.apple.com/documentation/healthkit/hkquery/1614787-predicateforworkouts)). However, we're not in Apple's beautiful walled garden anymore - so we need a different way to extract the workout-related data. I was stymied at first because the extracted healthKit data don't have any flag or metadata that indicate workout status. I know that specific sensors (like the heart rate monitor) sample at an increased frequency when a workout is started; however, I didn't feel confident with an approach that tried to determine workout status implicitly. Then, I realized that the healthKit zip contains a directory called ```workout-routes```. # Using Workout-Routes The ```workout-routes``` directory contains a bunch of ```.gpx``` files. I've never seen this type of file before. They're also known as GPS Exchange Format files and store geographic information such as waypoints, tracks, and routes. So, they're an ideal file format to store recordings of your position throughout a walk or run. If you're curious about these files, take a gander at these links: * [What is a ```GPX``` File?](https://hikingguy.com/how-to-hike/what-is-a-gpx-file/) * [GPS Exchange Format on Wikipedia](https://en.wikipedia.org/wiki/GPS_Exchange_Format) In short, this directory contains a record of every run and walk that I've been on! And in addition to exercises having GPS coordinates, they have timestamps! These files are a flavor of ```XML``` and contain a ton of trackpoints with timestamps. I asked chatGPT to whip up some code for extracting the first and last timestamps from the files (Prompt: ["could you help me parse a gpx file? I would like to get the first and last time stamp from all the trkpts in trkseg"](https://chat.openai.com/share/d1fc3c43-11cf-4429-877b-68c62e707dd5)). With that little script, we can filter out the extraneous data. # Workout Health Data I wrote a simple script to use the ```workout-routes``` to filter down the ```apple_health_export.csv```. By matching the start and end timestamps of the ```GPX``` files with HealthKit data streams, I could isolate just the sensor measurements associated with each workout. To do this, I read through all the ```GPX``` files in the ```workout-routes``` directory and got the workout timestamps. Then, I opened the ```apple_health_export.csv``` and filtered out all rows that did not occur between the start or end timestamps of a workout. You can find the workout health data extraction script [here](https://github.com/eotles/HealthKit-Analysis/blob/main/process_workout_health_data.py). The python script takes in the directory for ```workout-routes``` and the ```apple_health_export.csv``` file and returns ``workout_health_export.csv``. Optionally, it takes in a parameter for the file path for this new CSV. With this code, we now have a dataset of all the HealthKit samples that directly pertain to a running or walking workout (the workout types for which Apple calculates VO2 Max). # Jumping the (Data Analysis) Gun At this point, I got excited because I had data! So, I jumped directly to machine learning; I did some more initial workout data preprocessing and called SkLearn to make some models. The results were... OK (MAE of ~1 for a value usually in the 30s). Several hours into model selection, I realized I had jumped the gun. I decided to call back the cavalry and do a thorough job of data exploration before training models. This data exploration process is what we will focus on in the next post. Cheers,
Erkin
[Go ÖN Home](https://eotles.com) ## Acknowledgements I want to thank [Emily A. Balczewski](https://www.linkedin.com/in/ebalczewski/) for reviewing this post and providing feedback on it and the project! ------------------------ File: 2023-11-24-QRS-Star.md Creation Date: "Fri, 27 Feb 2026 19:13:30 +0000" --- title: "QRS*: The Next Frontier in Simulated Cardiac Intelligence" last_modified_at: 2023-11-24 categories: - Blog tags: - AI - artificial intelligence - cardiac intelligence - healthcare - technology - OpenAI - Q* - AGI - EKG - ECG - cardiology - medical technology - medical education - EKG analysis - ECG analysis - medical education tools - digital health - health innovation - simulation - ChatGPT - satire header: teaser: "/assets/images/insta/IMG_0541.JPG" overlay_image: "/assets/images/insta/IMG_0541.JPG" overlay_filter: 0.5 # same as adding an opacity of 0.5 to a black background excerpt: "Dive into the world of QRS*, where cardiac rhythms meet cutting-edge simulation. Forget Q*'s quest for AI supremacy – here, we're revolutionizing how we view heartbeats, one waveform at a time!" --- # Introduction In the world of tech and AI, where acronyms like GPT, DALL-E, and now Q\* reign supreme, I've decided it's high time to introduce a new player to the scene: QRS\*. While the tech giants are busy chasing the elusive dream of Artificial General Intelligence, I’ve been on a slightly different path - revolutionizing the way we understand the human heart. No big deal, right? # What is QRS?\* So, what is QRS\*? Imagine if you could peek into the inner workings of the human heart, understand its every quiver and quake, without so much as a stethoscope. That's QRS\* for you – an EKG simulator that generates complex heart waveforms with the click of a button. Born from a blend of frustration and genius (if I may say so myself), this simulator lets you play God with EKG parameters, visualizing cardiac pathologies as though you’re controlling the very heartbeat of life. # The Inspiration Behind QRS - A Story of Frustration & Triumph\* My journey to creating QRS\* was not unlike climbing Everest in flip-flops. As a medical tech enthusiast, I was appalled by the scarcity of tools that allowed for straightforward EKG waveform generation. So, what does any self-respecting physician-engineer in training do? Create their own, obviously. QRS\* was born from countless hours of coding, gallons of coffee, and an unwavering belief that if you want something done right, you’ve got to do it yourself and ask ChatGPT. # QRS\* vs Q\*: A Battle of the Acronyms Now, let’s talk about the elephant in the room – Q\*. While OpenAI is busy wrestling with the moral and existential quandaries of their AI brainchild, here I am, introducing a tool that might not ponder the meaning of life but can certainly simulate a mean EKG. QRS\* may not unlock the secrets of the universe, but it will unlock the mysteries of wide QRS complexes and peaked T-waves. Take that, Q\*! # Technical Wonders of QRS\* Delving into the technicalities of QRS\* is like taking a stroll in a digital cardiac park. Using unsophisticated algorithms (and a pinch of html), QRS\* translates mundane parameters into a symphony of EKG rhythms. It’s like having a cardiac orchestra at your fingertips – each parameter tweak a note, creating melodies that represent the most intricate cardiac conditions. # The Future of QRS\* As for the future, who’s to say QRS\* won’t evolve into the first Cardiac General Intelligence system? Today, it’s EKG waveforms; tomorrow, it might just be diagnosing heart conditions with a sophistication that rivals the worst medical students. The possibilities are as limitless. # Conclusion In conclusion, while the world gawks at the advancements in AI with Q\*, I invite you to marvel at the wonder that is QRS\*. It may not solve existential crises or write poetry, but it’s changing the game in EKG simulation. So, go ahead, give it a whirl and become part of this cardiac revolution. Check out the simulator below, and remember – in a world full of Qs, be a QRS. Cheers,
Erkin
[Go ÖN Home](https://eotles.com) ## P.S. This post was writen primarily by ChatGPT :) ------------------------ File: 2023-11-28-Programmatic-LLM-Exploration.md Creation Date: "Fri, 27 Feb 2026 19:13:30 +0000" --- title: "Playing Around with Programmatic LLM Access" last_modified_at: 2023-11-29 categories: - Blog tags: - technology - programming - artificial intelligence - Large Language Model - LLM - ChatGPT - ChatGPT-3.5 - ChatGPT API - Llama - Llama-2 - machine learning header: teaser: "/assets/images/insta/44CDD86E-0463-4727-9B84-7C7A32C00329.jpg" overlay_image: "/assets/images/insta/44CDD86E-0463-4727-9B84-7C7A32C00329.jpg" overlay_filter: 0.5 # same as adding an opacity of 0.5 to a black background excerpt: "Exploring the practicalities and nuances of interacting with Large Language Models (LLMs) programmatically." --- # Introduction Large Language Models (LLMs) like ChatGPT and Llama-2 have been 🔥on fire 🔥. I've been using these models for a while and recently realized that while I extensively use them to help me program faster, I usually leave them out of my target code. I recently conducted a super manual task involving a small amount of fuzzy reasoning. Naturally, after spending all that time, I wanted to know whether an LLM could have handled the job. Manually prompting ChatGPT showed some promising results, but conducting a thorough analysis using ChatGPT's web chat interface would have been unreasonable.

Erkin
[Go ÖN Home](https://eotles.com) ## P.S. Exploring Ollama [Ollama](https://ollama.ai) is another potential avenue for running LLMs locally. I plan to check it out to see their dockerized deployments' performance. Running the LLM on a docker container on my machine was my initial goal, but my initial attempts failed severely. ## P.P.S. Handling the OpenAI Key Securely Like many other APIs, you need an API key to access OpenAI's ChatGPT API calls. I don't like storing the key in plain text in my Jupyter notebook (just in case I share the notebook publicly). To address this, I developed this little code snippet that I put in my Jupyter notebooks that use the ChatGPT API: ``` # Required imports import os import getpass # Prompt for the API key OPENAI_API_KEY = getpass.getpass("Enter your OPENAI_API_KEY: ") # Set the key as an environment variable os.environ["OPENAI_API_KEY"] = OPENAI_API_KEY # Verify the environment variable is set print("Environment variable OPENAI_API_KEY set successfully.") ``` This method uses ```getpass``` to securely input the API key and ```os``` to set the key as an environment variable. This approach keeps the key out of the codebase, reducing the risk of accidental exposure. ## Acknowledgements I want to thank [Kevin Quinn](https://kevinquinn.fun) for reviewing this post and providing feedback on it and the project! ------------------------ File: 2023-12-08-Github-Action-for-Post-Concatenation-Update.md Creation Date: "Fri, 27 Feb 2026 19:13:30 +0000" --- title: "Revamping GitHub Action for Post Concatenation" categories: - Blog tags: - git - github - github actions - github pages - CI/CD - blogging - jekyll - minimal mistakes - minimal-mistakes - automation tools - web development - workflow optimization - LLM - chatGPT - data engineering header: teaser: "/assets/images/insta/IMG_2253.JPG" overlay_image: "/assets/images/insta/IMG_2253.JPG" overlay_filter: 0.5 # same as adding an opacity of 0.5 to a black background excerpt: "It's never too early to fix a mistake you've made with continuous integration." --- In a [previous post](/blog/Github-Action-for-Post-Concatenation/), I discussed a GitHub Action automation that I set up. In that post, I showcased how they could automate the concatenation of blog posts. But, as it turns out, ya boi is a little dumb. I made a mistake, and it didn't work correctly, as the continuous integration I had set up was a little less continuous than I had planned—apologies about misleading y'all, mea culpa, mea maxima culpa. This post is all about righting that terrible wrong. # The Issue with the Original Automation Initially, the GitHub Action was designed to trigger upon each commit. It seemed seamless, but I recently realized it wasn't functioning as I anticipated. The trigger was not triggering correctly, causing the concatenation action not to happen and defeating the original post's whole purpose. # Rewriting the Automation The solution? A minor overhaul. I shifted the automation trigger from commit-based to a more reliable, time-based approach. Now, the GitHub Action kicks off every hour, ensuring a consistent and timely update to the blog, irrespective of when I commit. # Updated GitHub Workflow YAML The critical update is in the first couple of lines of the workflow YAML. Here's a glimpse into the modification: ``` # Excerpt from concatenate_posts.yml on: schedule: - cron: '0 * * * *' ``` This snippet illustrates the shift to a cron schedule, triggering the Action hourly. It's a simple yet effective change, enhancing the reliability of the automation process. This process now runs every hour and creates an updated concatenated posts file. The whole YAML file is as follows: ``` name: Hourly Check and Concatenate MD Files with Metadata on: schedule: - cron: '0 * * * *' jobs: check-main-branch: runs-on: ubuntu-latest steps: - name: Checkout repository uses: actions/checkout@v2 - name: Concatenate .md files with metadata run: | mkdir -p workflows_output > workflows_output/concatenated_posts.md cd _posts for file in *.md; do echo "File: $file" >> ../workflows_output/concatenated_posts.md echo "Creation Date: $(git log --format=\"%aD\" -n 1 -- $file)" >> ../workflows_output/concatenated_posts.md cat "$file" >> ../workflows_output/concatenated_posts.md echo "------------------------" >> ../workflows_output/concatenated_posts.md done - name: Commit and push if there are changes run: | git config --local user.email "action@github.com" git config --local user.name "GitHub Action" git add -A git diff --quiet && git diff --staged --quiet || git commit -m "Concatenated .md files with metadata" git push ``` Cheers,
Erkin
[Go ÖN Home](https://eotles.com) ------------------------ File: 2023-12-08-Introducing-BiomedWaveforms.md Creation Date: "Fri, 27 Feb 2026 19:13:30 +0000" --- title: "Biomedical Waveforms" last_modified_at: 2023-12-11 categories: - Blog tags: - medicine - cardiac intelligence - EKG - ECG - EKG analysis - ECG analysis - cardiology - biomedical waveforms - capnography - capnogram - anesthesia - cardiac monitors - ventilators - medical technology - medical education - medical education tools - digital health - health innovation - software development - software engineering - web development - javascript excerpt: "Unveiling the alpha version of BiomedWaveforms, an open-source JavaScript framework to generate and plot commonly used biomedical waveforms, like EKGs and capnograms. Dive into a world where you can fiddle with vital signs through the power of programming, making these crucial waveforms more accessible and understandable." header: teaser: "/assets/images/insta/E7F02873-C46F-4DB3-9BB4-75433F6E7CEB_1_105_c.jpeg" overlay_image: "/assets/images/insta/E7F02873-C46F-4DB3-9BB4-75433F6E7CEB_1_105_c.jpeg" overlay_filter: 0.5 # same as adding an opacity of 0.5 to a black background --- # Note to Readers: Hey there! You're about to read an early version of my latest blog post, introducing the ```BiomedWaveforms``` project. This isn't the final cut – it's more of a 'work-in-progress' showcase. There might be a few rough edges, a typo here, or a technical misstep there. But that's where you come in! I'm eagerly seeking your feedback, insights, and suggestions. Whether you're a physician, an engineer, or just someone fascinated by the intersection of these fields, your input is invaluable. Help me refine this post, enhance its accuracy, and enrich its perspective. I am looking forward to your constructive critiques and creative ideas! Cheers,
Erkin # Introduction I'm excited to introduce [```BiomedWaveforms```](https://eotles.com/BiomedWaveforms/), a project that started pulling at my heartstrings a few months ago. I developed the alpha version of ```BiomedWaveforms``` between the odd hours of my ICU sub-internship. It is a simple JavaScript framework – free, open-source, and dedicated to simulating biomedical waveforms like EKGs, capnograms, and more.


Erkin
[Go ÖN Home](https://eotles.com) ------------------------ File: 2024-03-08-AI-Medicine-Primer.md Creation Date: "Fri, 27 Feb 2026 19:13:30 +0000" --- title: "A Primer on Al in Medicine" last_modified_at: 2024-03-27 categories: - Blog tags: - medicine - artificial intelligence - machine learning - healthcare - medical education - FDA - clinical decision support - technology in medicine header: teaser: "/assets/images/insta/IMG_0429.JPG" overlay_image: "/assets/images/insta/IMG_0429.JPG" overlay_filter: 0.5 # same as adding an opacity of 0.5 to a black background excerpt: "The three questions you should feel comfortable asking as a physician when confronted with an AI system." --- # A Primer on AI in Medicine Medicine is fast approaching a revolution in how it processes information and handles knowledge. This revolution is driven by advances in artificial intelligence (AI). These tools have the potential to reshape the way we work as physicians. As such, it is imperative that we, as physicians, equip ourselves with the knowledge to navigate and lead in this new terrain. My journey through the MD-PhD program at the University of Michigan has afforded me a unique vantage point at the intersection of clinical practice and AI research. My experience makes me excited about the potential and weary about the potential risks. Ultimately, successfully integrating technology in medicine requires a deep understanding of human and technical factors. My previous work on [bringing human factors into primary care policy and practice](/blog/research/its-time-to-bring-human-factors-to-primary-care/) discusses how a deeper study of human factors is needed to make technology more impactful in healthcare. While we still need this deeper work, more minor changes to how we train physicians can also have a significant impact. Often, critical problems at the interface between physicians and technology aren't addressed because physician users are not empowered to ask the right questions about their technology. This "chalk talk" was initially designed to encourage fourth-year medical students to feel comfortable asking several fundamental questions about the AI tools they may be confronted with in practice. In addition to recording a slideshow version of the chalk talk, I have also taken the opportunity to write more about the topic and have included materials for medical educators looking to deliver or adapt this chalk talk. ## The Surge of AI in Healthcare The healthcare industry has witnessed an unprecedented surge in AI model development in recent years. The FDA certified its 692nd AI model in 2023, a significant leap from the 73 models certified less than five years prior. This rapid growth underscores the increasing role of AI in healthcare, from diagnostics to treatment and operations. However, it's crucial to recognize that many AI models bypass FDA certification, as they primarily serve as decision-support tools for physicians rather than direct diagnostic tools. For example, many of the models produced by vendors, like the [Epic sepsis model](/blog/research/External-Validation-of-a-Widely-Implemented-Proprietary-Sepsis-Prediction-Model-in-Hospitalized-Patients/), and internal models produced by health systems and their researchers do not need FDA certification. Together, these models constitute the vast majority of the healthcare AI iceberg.

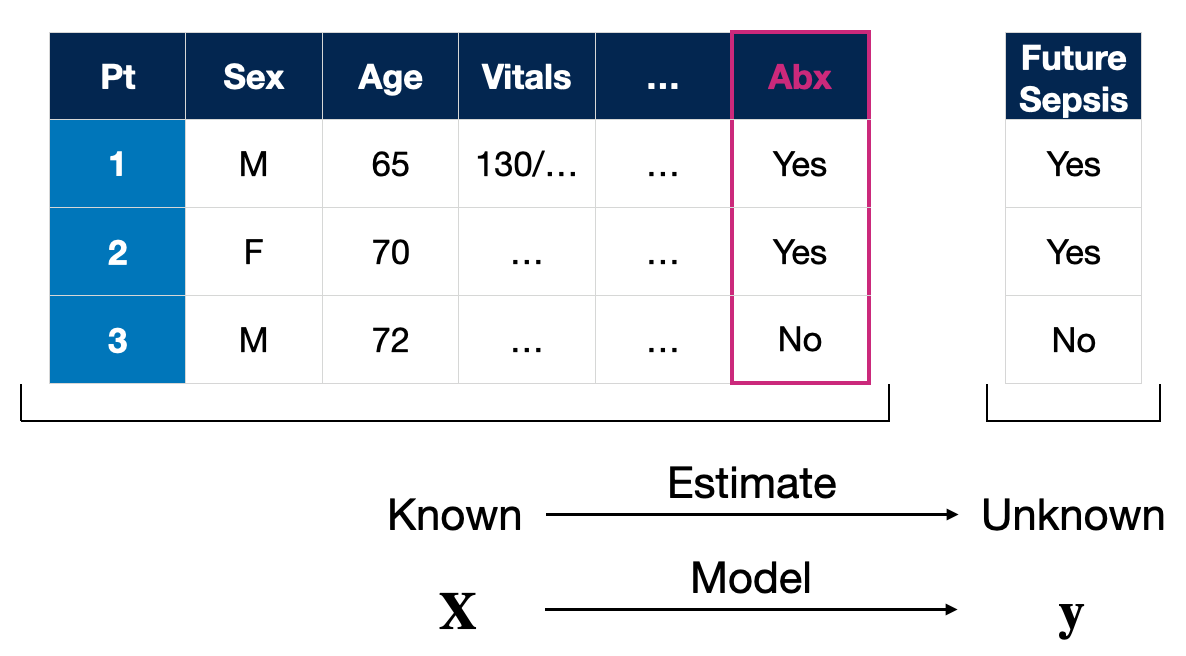
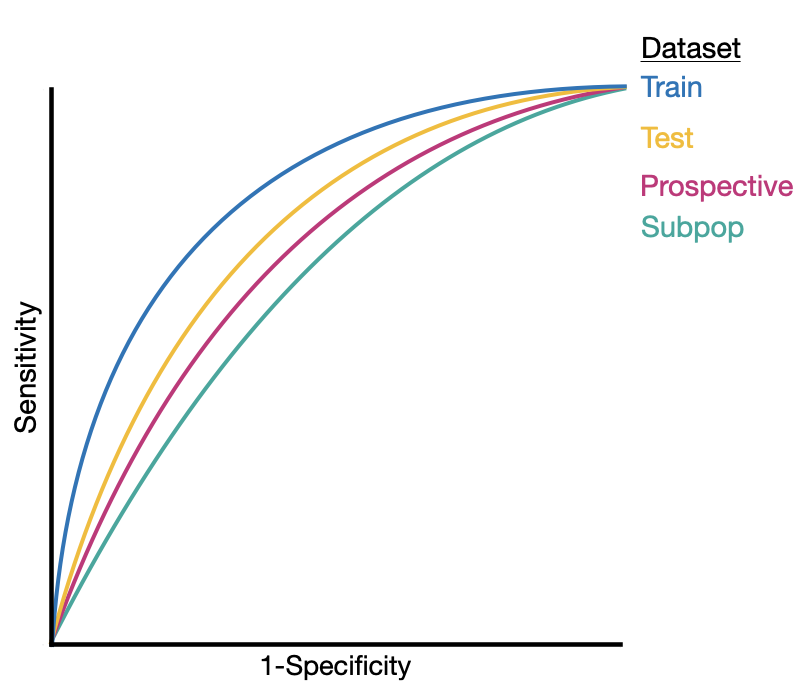
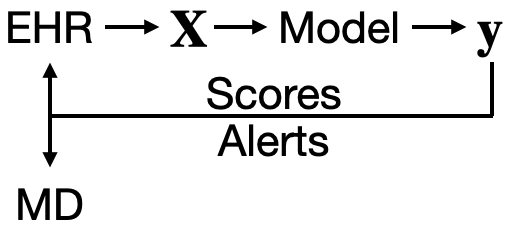
Erkin
[Go ÖN Home](https://eotles.com) ------------------------ File: 2024-04-03-Stanford-EMED-AI-in-Clinical-Care.md Creation Date: "Fri, 27 Feb 2026 19:13:30 +0000" --- title: "AI in Clinical Care: Stanford EM Faculty Development Series" last_modified_at: 2024-04-03 categories: - Blog - Talk tags: - medicine - healthcare - artificial intelligence - machine learning - generative artificial intelligence - healthcare AI - digital health header: teaser: "/assets/images/insta/IMG_1408.JPG" overlay_image: "/assets/images/insta/IMG_1408.JPG" overlay_filter: 0.5 # same as adding an opacity of 0.5 to a black background --- # AI in Clinical Care I am excited to be presenting at the upcoming Stanford EM Faculty Development series on Artificial Intelligence (AI). The talk, titled "AI in Clinical Care," is slated to be a wide ranging exploration into how AI is reshaping the landscape of clinical care. ## What to Expect - **Understanding AI in Medicine:** We'll peel back the layers of AI, machine learning, and deep learning, and how these technologies intersect with fields like operations research and statistics. - **From Predictive to Generative AI:** Discover how predictive models used for tasks like weather forecasting can inspire generative models in healthcare, predicting patient outcomes and optimizing care pathways. - **The Clinical Application of AI:** Learn about the real-world applications and challenges of non-generative AI tools, from development to implementation, and the crucial role of continuous evaluation. - **Venturing into Generative AI:** We'll delve into the realm of generative AI, including automated documentation, chart summarization, and the potential for clinical foundation models. [Link to download presentation.](https://eotles.com/assets/presentations/2024_Stanford_EM/2024_Stanford_EM.pdf) I plan on updating this post with a summary after I give the talk. Cheers,
Erkin
[Go ÖN Home](https://eotles.com) ------------------------ File: 2024-05-14-OUWB-Intro-to-AI-for-Medicine.md Creation Date: "Fri, 27 Feb 2026 19:13:30 +0000" --- title: "OUWB Med Education Week: Intro to AI for Medicine" last_modified_at: 2024-05-14 categories: - Blog - Talk tags: - medicine - healthcare - artificial intelligence - machine learning - generative artificial intelligence - healthcare AI - digital health header: teaser: "/assets/images/insta/IMG_1408.JPG" overlay_image: "/assets/images/insta/IMG_1408.JPG" overlay_filter: 0.5 # same as adding an opacity of 0.5 to a black background excerpt: "Lessons from Across the Healthcare AI Lifecycle." --- # Reimagining Medical Education - Harnessing AI I am excited to present at the Oakland University William Beaumont School of Medicine's medical education week. The week's theme is "Reimagining Medical Education," I'll contribute to the discussion on artificial intelligence (AI) in health professions. My talk, titled "Introduction to Artificial Intelligence for Medicine: Lessons from Across the Healthcare AI Lifecycle," aims to be a wide-ranging primer on how AI works and how it could positively reshape medicine under the guidance of clinicians. ## What to Expect - **Introduce, define, and contextualize Artificial Intelligence (AI) and Machine Learning (ML).** We will unpack the concepts of AI, machine learning, deep learning, and generative AI. - **Motivate the usage of AI systems in medicine.** I'll provide examples of how well-thought-out AI could improve clinical care. - **Provide a fundamental grounding for how AI systems work.** Throughout this discussion, I'll share insights into how these systems function and equip learners with the perspective to evaluate clinical AI tools. - **Discuss the current state and limitations of medical AI systems.** By exploring specific AI applications in medicine, I'll highlight some key issues to consider when integrating AI tools into clinical care. - **Motivate students to learn more about AI/ML.** At the end of this talk, audience members will feel empowered to learn more about healthcare AI to shape its future development. [Link to download presentation.](https://eotles.com/assets/presentations/2024_OUWB/2024_OUWB.pdf) I plan on updating this post with recordings or notable discussion points. Cheers,
Erkin
[Go ÖN Home](https://eotles.com) ------------------------ File: 2024-09-01-Healthcare-AI-Lifecycle.md Creation Date: "Fri, 27 Feb 2026 19:13:30 +0000" --- title: "An Introduction to the Healthcare AI Lifecycle: From Development to Implementation" last_modified_at: 2024-09-22 categories: - Blog tags: - medicine - healthcare - artificial intelligence - machine learning - data science - FDA - clinical decision support - technology in medicine - health IT - IT - AI lifecycle - healthcare AI lifecycle - AI model lifecycle - AI in medicine - clinical AI - medical AI - machine learning models in healthcare header: teaser: "/assets/images/insta/IMG_0816_blue.JPG" overlay_image: "/assets/images/insta/IMG_0816_blue.JPG" overlay_filter: 0.5 # same as adding an opacity of 0.5 to a black background excerpt: "Explore the healthcare AI lifecycle, a journey from development to implementation, unveiling how AI can transform patient care amidst the complexities of modern medicine." meta_description: "Explore the healthcare AI lifecycle, from model development to clinical implementation, and discover how AI is revolutionizing patient care through data-driven insights." --- # The Healthcare AI Lifecycle *Physicians frequently face life-or-death decisions in a bustling emergency department. With medical knowledge expanding exponentially, how can they synthesize the latest evidence to provide optimal care? Is there a way to bridge this gap between overwhelming data and timely, effective patient care?* ## The Challenge of Modern Healthcare The practice of medicine is defined by complexity and a scarcity of time. Physicians are expected to provide efficient, personalized, evidence-based care while navigating an ever-growing body of medical knowledge. The traditional Evidence-Based Medicine (EBM) approach, which relies on data from clinical trials and observational studies to guide decisions, can be challenging to apply in real-time clinical settings. EBM grounds diagnostic and therapeutic decision-making; however, it requires synthesizing multiple loosely connected pieces of scientific literature and assessing whether a patient's presentation aligns with findings or criteria from previously published studies. Consistently applying EBM decision-making in a busy clinical environment, especially one that caters to a wide range of patient conditions and acuity levels, like the emergency department, can be daunting. Additionally, the current EBM process has a long lead time. It can take years before data from a scientific study can be analyzed, assessed, disseminated, and integrated into clinical practice. ## Enter artificial intelligence. Although artificial intelligence has become a loaded term with many different meanings, my working definition is relatively simple: > *Artificial Intelligence* (AI) is intelligence, perceiving, synthesizing, or inferring information demonstrated by machines (non-human/non-living entities).[^1] We can use AI tools, also called models, to encode existing knowledge gathered from clinical trials or medical experts. Additionally, many recent advances in AI have been driven by a set of techniques collectively known as machine learning. > *Machine learning* (ML) techniques seek to build models that *learn* or improve performance on a task given more data.[^2] ML offers powerful techniques to create data-driven prediction models that align well with the objectives of EBM. ML methods can be used to rapidly develop models that learn the relationship between patient attributes (age, heart rate, etc.) and the patient's future outcomes (e.g., risk of developing diabetes). By leveraging AI and ML, we can significantly improve our ability to predict outcomes, personalize treatments, and ultimately enhance patient care. [^1]: I adapted this definition from [Wikipedia](https://en.wikipedia.org/wiki/Artificial_intelligence). [^2]: Another definition adapted from [Wikipedia](https://en.wikipedia.org/wiki/Machine_learning). ML models are already in clinical use, aiding the synthesis of complex medical information. The Food and Drug Administration (FDA) has approved [over 950 AI systems for various medical tasks](https://www.fda.gov/medical-devices/software-medical-device-samd/artificial-intelligence-and-machine-learning-aiml-enabled-medical-devices), ranging from analyzing electrocardiograms to detecting breast cancer on mammograms. Beyond these certified applications, health systems and health information technology (HIT) players, like electronic medical record (EMR) vendors, are developing and deploying AI systems that don't require FDA certification. These tools are designed to assist physicians by providing risk estimates. The goal is to integrate these tools into medical decision-making processes and enhance the precision and effectiveness of patient care. The landscape of healthcare AI systems is incredibly diverse. AI tools can enhance or inform patient care, clinical decision-making, or operational efficiency. Despite their variety, these systems fundamentally operate the same way as information processing tools. So, whether used by patients, clinicians, or health systems, these tools share commonalities in their development and utilization. Ensuring the safety and effectiveness of these systems requires a standard series of steps, collectively referred to as the *healthcare AI lifecycle*. This lifecycle encompasses all the necessary phases to bring a healthcare AI system from conception to practical medical application. ## Understanding the Healthcare AI Lifecycle The healthcare AI lifecycle can be divided into two principal phases: * Development, when AI tools are created * Implementation, when AI tools are used in practice It's crucial to recognize that the journey of developing healthcare AI is continuous and doesn't conclude once a model is deployed. This ongoing commitment is vital to the success of AI in healthcare. Like all other software development, healthcare AI requires refinement and iteration to adapt to new data, evolving medical knowledge, and changing clinical needs. The distinction between development and implementation is somewhat artificial. Effective AI integration into healthcare systems necessitates a blend of these phases, mirroring the principles of software engineering best practices. Feedback loops between development and implementation ensure that AI tools remain relevant, accurate, and beneficial. This iterative process, akin to agile methodologies in software engineering, is vital for maintaining the safety, efficacy, and utility of AI systems in a dynamic healthcare environment. We can foster a more holistic approach by aligning AI development and implementation with established software engineering best practices. This perspective encourages ongoing collaboration between developers and healthcare professionals, ensuring that AI tools evolve with medical advancements and real-world clinical experiences. Bridging these phases can enhance the robustness and reliability of healthcare AI systems, ultimately leading to better patient outcomes and more efficient clinical workflows.
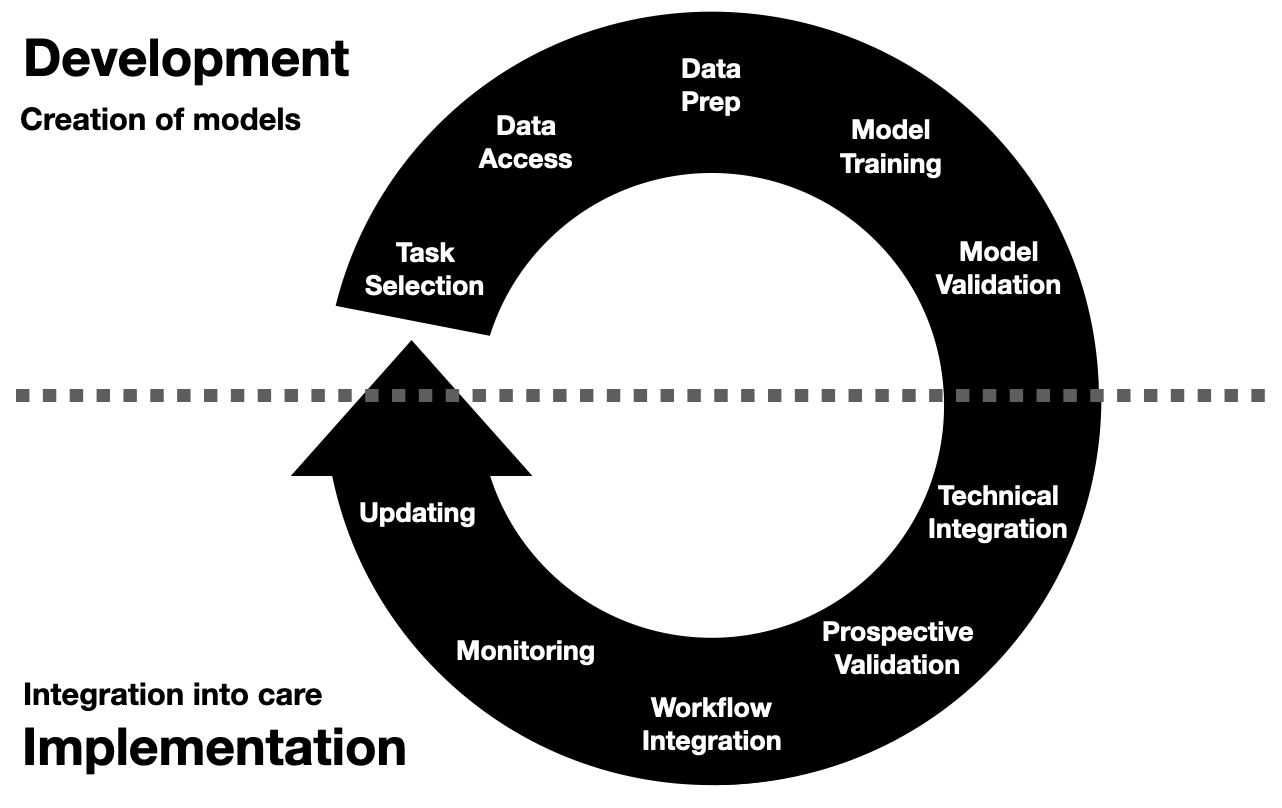
Erkin
[Go ÖN Home](https://eotles.com) ------------------------ File: 2024-09-02-Healthcare-AI-Development.md Creation Date: "Fri, 27 Feb 2026 19:13:30 +0000" --- title: "Healthcare AI Development: From Data Access to Model Validation" last_modified_at: 2024-10-10 categories: - Blog tags: - medicine - healthcare - artificial intelligence - machine learning - data science - FDA - clinical decision support - technology in medicine - AI model development - AI in medicine - clinical data science - healthcare machine learning models - AI model training - model validation header: teaser: "/assets/images/insta/IMG_0816_red.JPG" overlay_image: "/assets/images/insta/IMG_0816_red.JPG" overlay_filter: 0.5 # same as adding an opacity of 0.5 to a black background excerpt: "A deep dive into healthcare AI model development, from selecting tasks to preparing data and validating models, highlighting the challenges and opportunities in making healthcare ML models." meta_description: "A deep dive into healthcare AI model development, covering task selection, data access, preparation, training, and validation to ensure model success in clinical practice." --- # Healthcare AI Development Welcome to the second post in our series on the healthcare AI lifecycle. To start at the beginning, go to the [overview post on the healthcare AI lifecycle](/blog/Healthcare-AI-Lifecycle/). Having established a general framework for the healthcare AI lifecycle, it's time to cover some specifics. Without a better starting point[^1], this post focuses on what I perceive to be the "beginning" of the AI lifecycle: the development phase. *Development* encompasses the various processes involved in creating an AI model. This phase is foundational, as the quality and success of the AI system largely depend on the quality of the development process. Every step—from selecting the right task through training the model to validating its performance—is crucial to ensuring that the AI tool is effective and reliable in real-world clinical settings. By the end of this post, you will have a comprehensive understanding of the critical steps in developing healthcare AI models and the challenges and considerations associated with each step.
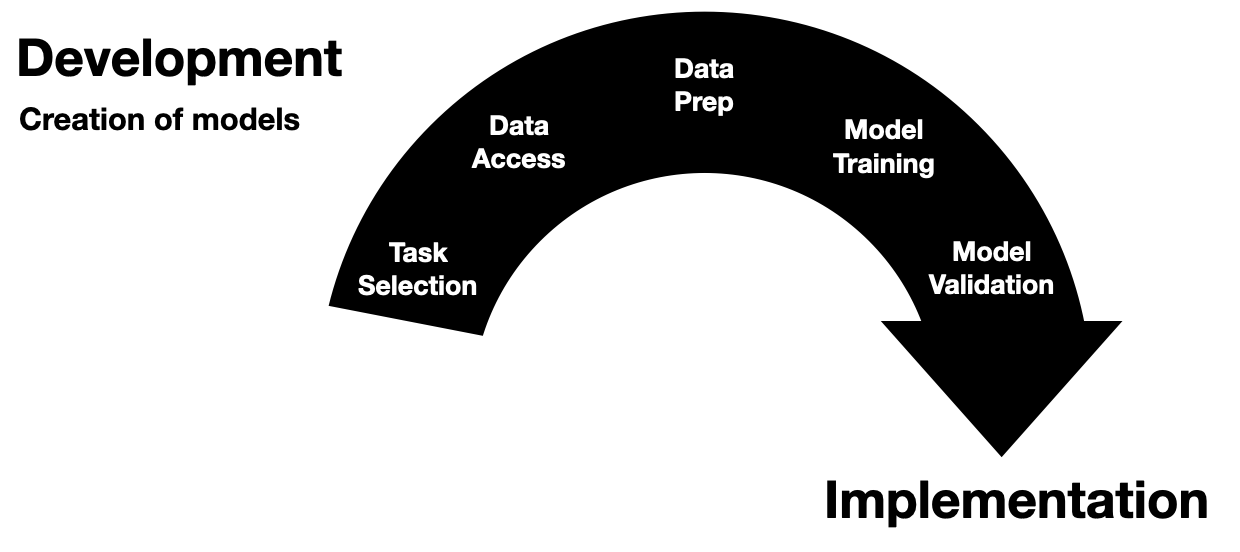
Erkin
[Go ÖN Home](https://eotles.com) [^1]: "If you wish to make an apple pie from scratch, you must first invent the universe." - Carl Sagan ------------------------ File: 2024-09-03-Healthcare-AI-Implementation.md Creation Date: "Fri, 27 Feb 2026 19:13:30 +0000" --- title: "Healthcare AI Implementation: Steps for Successful Clinical Integration" last_modified_at: 2024-09-20 categories: - Blog tags: - medicine - healthcare - artificial intelligence - machine learning - data science - FDA - clinical decision support - technology in medicine - implementation - implementation science - AI implementation in healthcare - clinical AI integration - healthcare AI workflow - model integration - prospective validation header: teaser: "/assets/images/insta/IMG_0816_yellow.JPG" overlay_image: "/assets/images/insta/IMG_0816_yellow.JPG" overlay_filter: 0.5 # same as adding an opacity of 0.5 to a black background excerpt: "A look at the crucial steps in AI implementation, covering technical integration, prospective validation, and model monitoring to ensure AI tools make a meaningful impact in healthcare." meta_description: "Explore the crucial steps of implementing healthcare AI, including technical integration, prospective validation, workflow integration, and monitoring to improve clinical outcomes." --- *You've developed an AI model that could "revolutionize" patient care—but how do you ensure it truly impacts the clinical workflow and improves outcomes? This is where implementation becomes paramount.* # Implementing Healthcare AI This post builds off of a [previous introduction to the healthcare AI lifecycle](/blog/Healthcare-AI-Lifecycle/) and a discussion on healthcare [AI development](/blog/Healthcare-AI-Development/). These are not necessary pre-reading, but they provide a good background for the main focus of this post: Implementation *Implementation* is the work of integrating and utilizing an AI model into clinical care. This post will first cover key implementation steps and general challenges associated with implementing AI tools in healthcare.
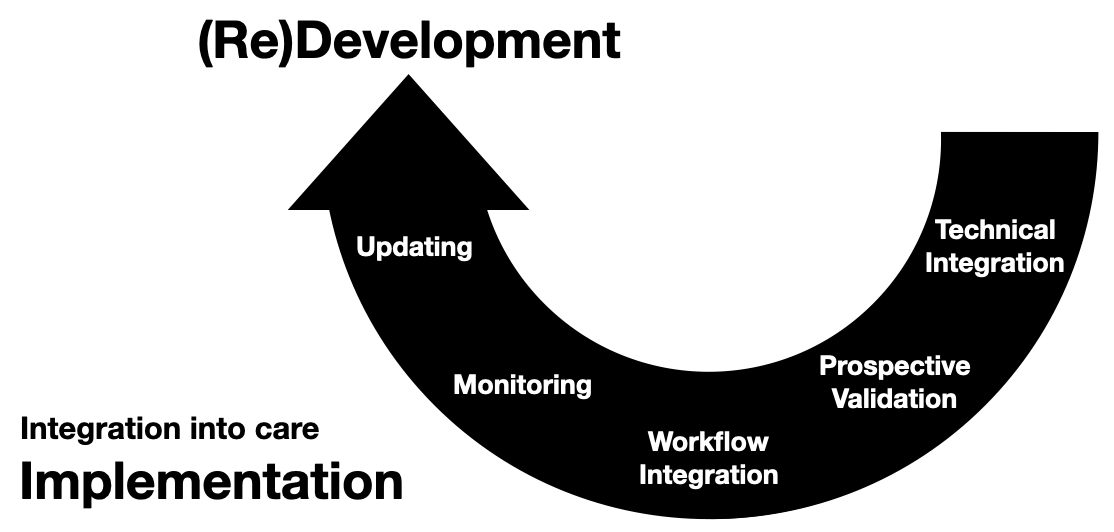
Erkin
[Go ÖN Home](https://eotles.com) ------------------------ File: 2024-09-10-Healthcare-AI-Infrastructure.md Creation Date: "Fri, 27 Feb 2026 19:13:30 +0000" --- title: "Healthcare AI Infrastructure: Key Systems for Making & Using Clinical AI Models" last_modified_at: 2024-09-22 categories: - Blog tags: - medicine - healthcare - artificial intelligence - machine learning - data science - FDA - clinical decision support - technology in medicine - implementation - implementation science - AI development environments - healthcare data infrastructure - research data warehouses - clinical AI tools - model development tools - AI infrastructure in healthcare - healthcare IT infrastructure - EMR integration - AI system infrastructure - clinical AI development header: teaser: "/assets/images/insta/785385DC-5E5C-47B4-987D-E89D8DCBF9CB_pink.png" overlay_image: "/assets/images/insta/785385DC-5E5C-47B4-987D-E89D8DCBF9CB_pink.png" overlay_filter: 0.5 # same as adding an opacity of 0.5 to a black background excerpt: "Infrastructure is king. An intro to the foundational healthcare IT systems that power AI, focusing on how electronic medical records & technical integration shape the development and deployment of healthcare AI models." meta_description: "An introduction to healthcare AI infrastructure, focusing on the systems that support the development and integration of AI models into clinical workflows." --- # Healthcare AI Infrastructure For a general overview of the healthcare AI lifecycle, check out the [introductory post](/blog/Healthcare-AI-Lifecycle/). This post started as a brief overview of healthcare AI infrastructure and then grew into an unwieldy saga incorporating my perspectives on building and implementing these tools. As such, I split the post into a couple of parts. In this post we will review the existing HIT landscape and provide a general set of approaches for development and implementation. This'll be followed by detailed posts on development and implementation. These posts provide more technical details and discuss a couple of projects I've shepherded through the AI lifecycle. Additionally, this series will focus on AI models that interact with electronic medical records (EMR) and related enterprise IT systems used by health systems. This focus is partly due to my expertise—I worked for an EMR vendor and have built and deployed several models in this setting. However, it is also a natural interaction point. We connect AI models with EMRs because EMRs are the software systems most closely tied to care delivery. Given this framing, we will now lay out the significant components. ## Basic Healthcare IT Infrastructure Let's start by grounding our conversation on the most fundamental healthcare information technology (HIT) infrastructure component: electronic medical records systems (EMRs). We will focus on EMRs because they are often the source and destination of information processed by healthcare AI systems. A solid understanding of the subcomponents of the EMR is necessary for creating healthcare AI infrastructure.
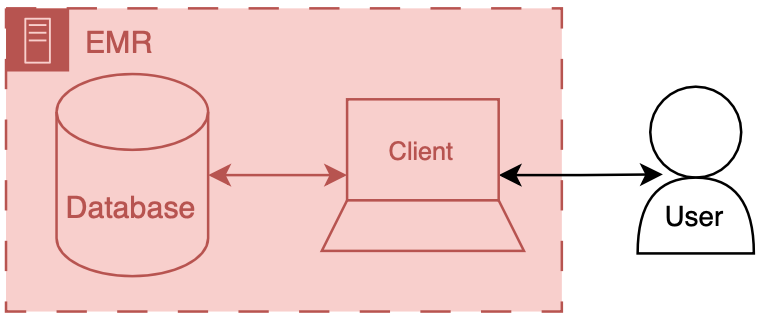
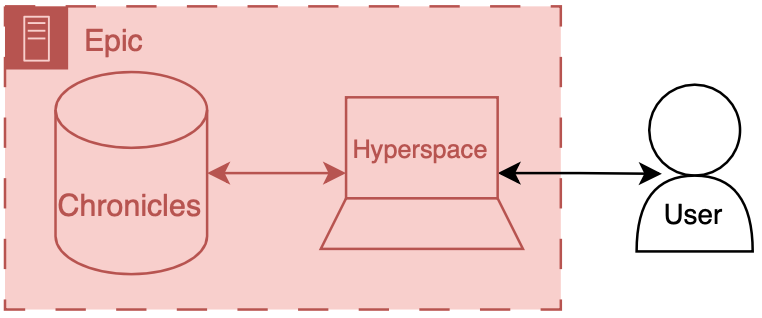
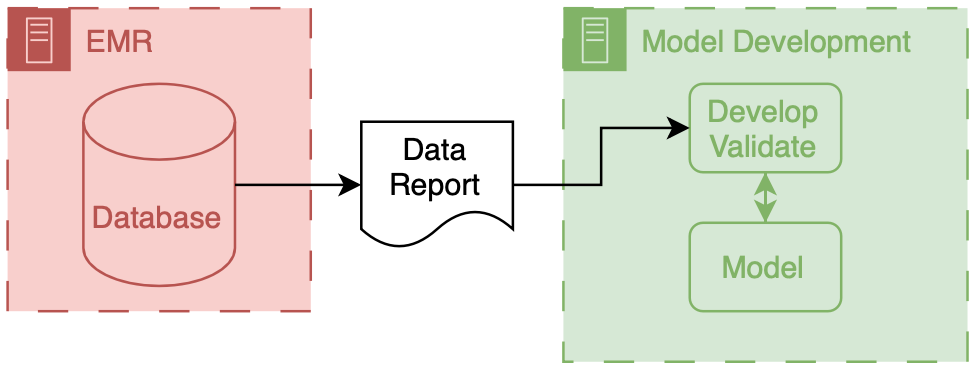
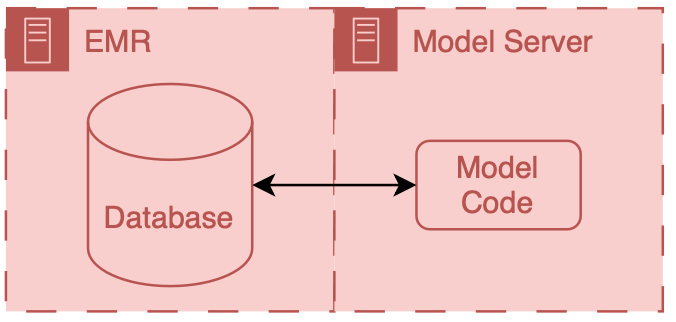
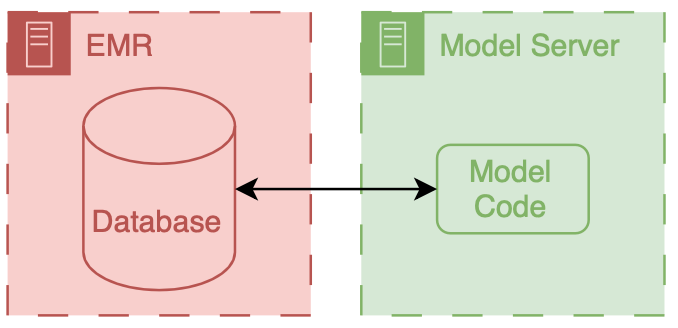
Erkin
[Go ÖN Home](https://eotles.com) [^1]: This can be complicated because you need to maintain your own application server and also deal with passing authentication between the EMR session and your application. ------------------------ File: 2024-09-11-Healthcare-AI-Infrastructure-Development.md Creation Date: "Fri, 27 Feb 2026 19:13:30 +0000" --- title: "Healthcare AI Development Infrastructure: Tools and Data for Model Creation" last_modified_at: 2024-09-22 categories: - Blog tags: - medicine - healthcare - artificial intelligence - machine learning - data science - FDA - clinical decision support - technology in medicine - implementation - implementation science - AI development environments - healthcare data infrastructure - research data warehouses - clinical AI tools - model development tools header: teaser: "/assets/images/insta/785385DC-5E5C-47B4-987D-E89D8DCBF9CB_yellow.png" overlay_image: "/assets/images/insta/785385DC-5E5C-47B4-987D-E89D8DCBF9CB_yellow.png" overlay_filter: 0.5 # same as adding an opacity of 0.5 to a black background excerpt: "An in-depth look at the tools and environments needed to develop AI models for healthcare, emphasizing the importance of integrating implementation considerations early in the development process." meta_description: "Explore the healthcare AI development infrastructure, from accessing clinical data to setting up secure development environments for training AI models." --- # Healthcare AI Development Infrastructure This post is a part of the healthcare AI infrastructure series. Check out the [intro post for a general lay of the land](/blog/Healthcare-AI-Infrastructure/). ## Implementation Should Inform Development This post introduces several tools for developing healthcare AI models. Although AI models can be developed in isolation and implemented later, it's more effective to approach development and implementation as interconnected processes. Projects are more successful when this connection is recognized, as most healthcare AI initiatives fail during implementation. These failures often stem from neglecting the constraints imposed by real-world applications. By understanding implementation challenges early on and designing with them in mind, you significantly increase the chances of success when it's time to deploy the model. While this post focuses on development, it's written from the perspective of someone who has been through the entire process many times. I encourage you to read the upcoming post on implementation as well so you can fully understand the lifecycle before beginning your journey. ## Overview As mentioned in the [last post](/blog/Healthcare-AI-Infrastructure/), two key components are needed to build a model: data and a development environment (a computer). Data often comes from clinical databases, such as those in an EMR or other clinical systems. Once obtained, this data is transferred to computing environments designed specifically for model development, typically equipped with specialized software and hardware.
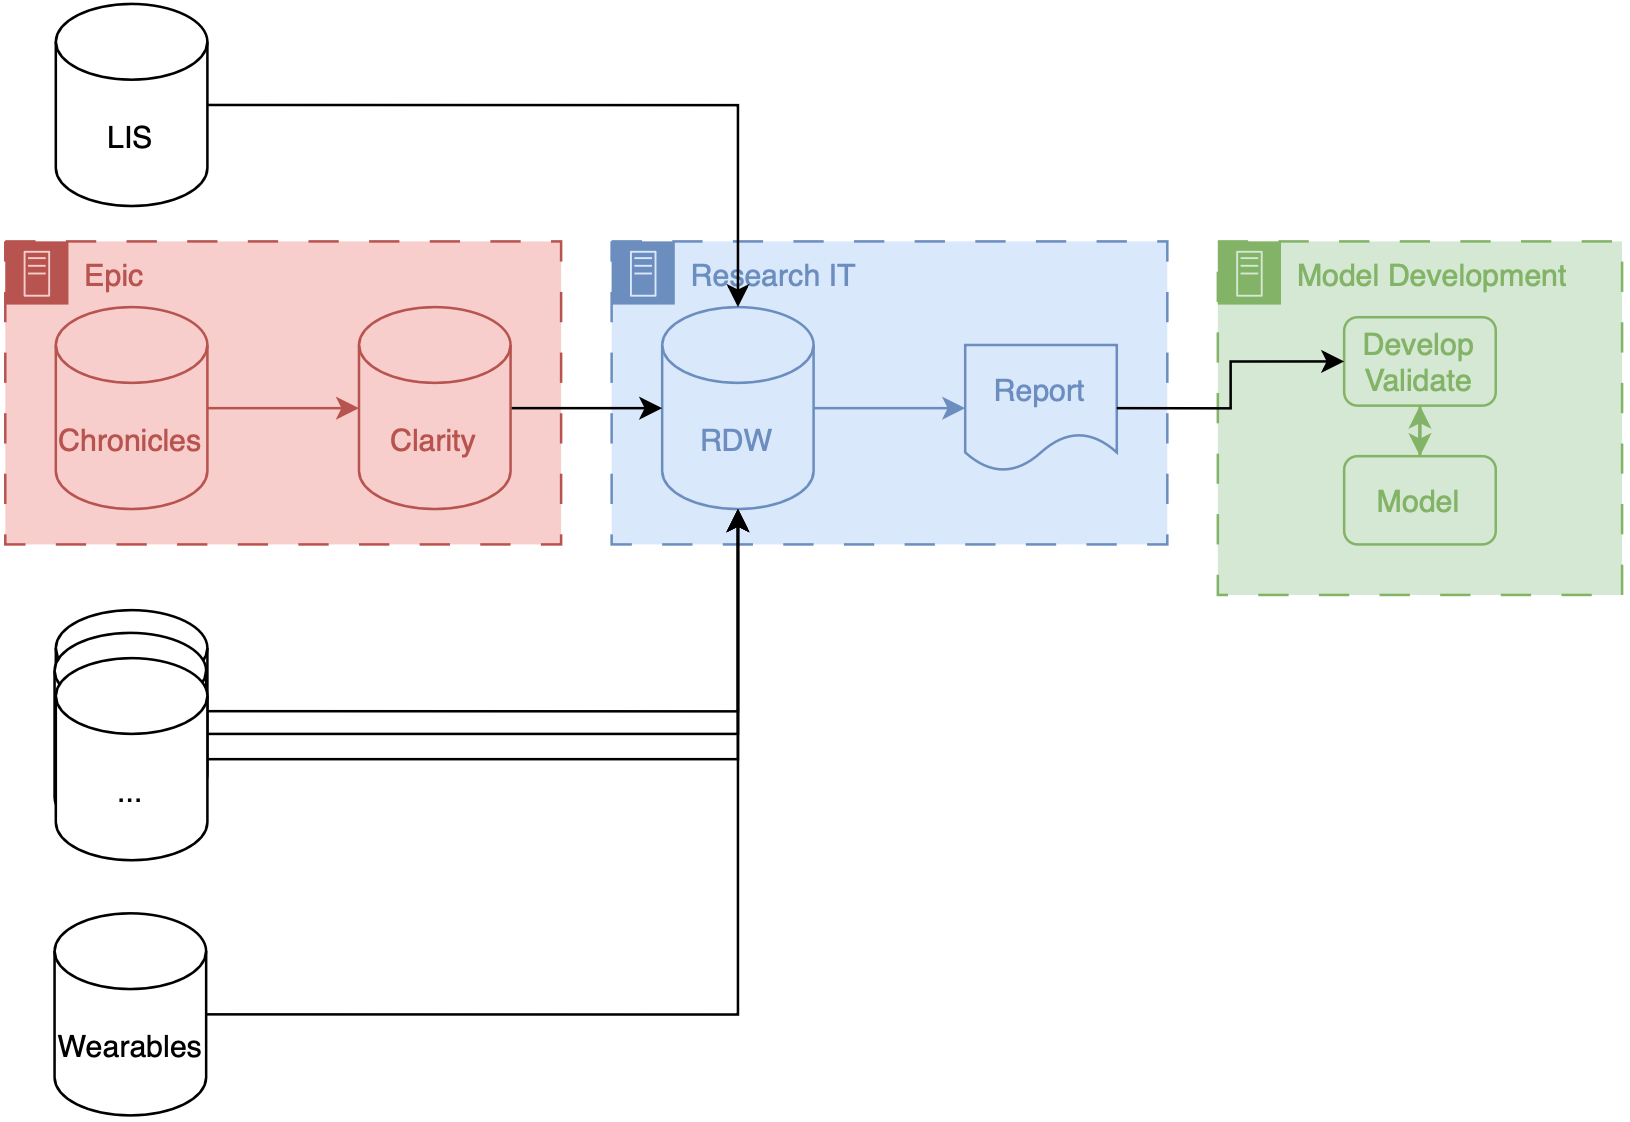
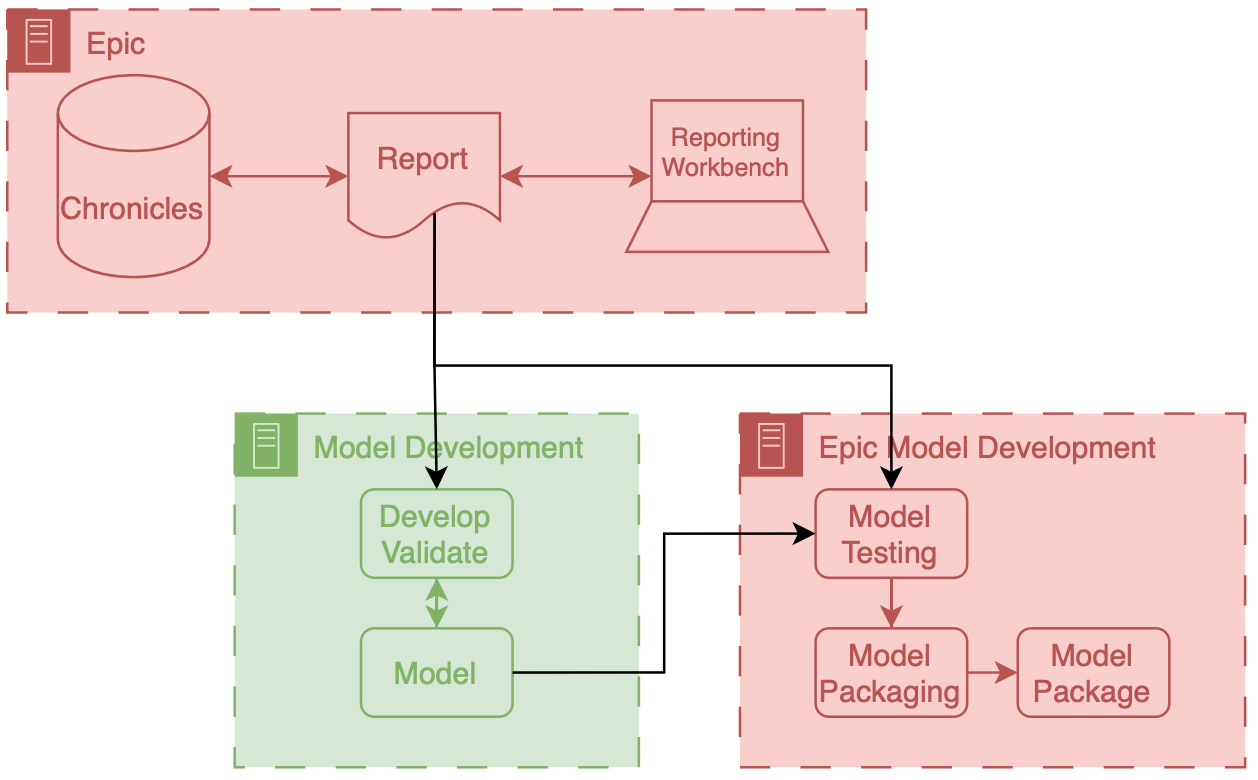
Erkin
[Go ÖN Home](https://eotles.com) [^1]: I've never done a cost breakdown analysis for on-premises vs. cloud for healthcare AI research, but I'd love to see results if anyone has some handy. ------------------------ File: 2024-09-12-Healthcare-AI-Infrastructure-Implementation.md Creation Date: "Fri, 27 Feb 2026 19:13:30 +0000" --- title: "Healthcare AI Implementation Infrastructure: Technical Tools for AI Model Integration" last_modified_at: 2024-09-22 categories: - Blog tags: - medicine - healthcare - artificial intelligence - machine learning - data science - FDA - clinical decision support - technology in medicine - implementation - implementation science - AI model integration - clinical AI infrastructure - EMR AI integration - healthcare system AI - AI implementation tools header: teaser: "/assets/images/insta/785385DC-5E5C-47B4-987D-E89D8DCBF9CB_blue.png" overlay_image: "/assets/images/insta/785385DC-5E5C-47B4-987D-E89D8DCBF9CB_blue.png" overlay_filter: 0.5 # same as adding an opacity of 0.5 to a black background excerpt: "A guide to the technical infrastructure needed to integrate AI models into clinical workflows, covering both internal and external integration approaches and their impact on data security and system performance." meta_description: "A detailed guide to healthcare AI implementation infrastructure, focusing on internal and external approaches to integrating AI models into clinical systems." --- Welcome to the next installment in our healthcare AI infrastructure series. If you've been following along, we've already explored the foundational components of healthcare AI in earlier posts, covering the overall [AI lifecycle](/blog/Healthcare-AI-Lifecycle/) and diving deeper into [AI development](/blog/Healthcare-AI-Development/) and [implementation](/blog/Healthcare-AI-Implementation/) processes. Most recently, we focused on the technical underpinnings of [AI development infrastructure](/blog/Healthcare-AI-Infrastructure-Development/) and the broader [healthcare IT landscape](/blog/Healthcare-AI-Infrastructure/) that makes modern AI models possible. # Healthcare AI Implementation Infrastructure In this post, we shift gears to discuss the nuts and bolts of connecting AI models to real-world clinical workflows, an often overlooked but essential step in the AI lifecycle—implementation. While development gets a lot of attention, the success of any healthcare AI tool is ultimately determined by how well it integrates into existing health IT systems. As we explore the technical infrastructure needed to support these implementations, we'll break down key concepts, such as internal versus external integration, and provide insights into how these choices shape AI deployments' reliability, flexibility, and security. A couple of notes before we start. Although this might not seem that important to the engineers who are on the AI research and development side of things, I would argue that understanding the downstream will not only increase your success of projects eventually making a clinical impact but also that there are exciting and cool research ideas that can come out of thinking about development. Although the implementation goes beyond the technology, this section primarily delves into the 'nuts-and-bolts' of the implementation step, known as technical integration. This is the process of connecting AI models to existing HIT systems. By the end of this post, you'll have a clearer understanding of the infrastructure choices that impact the successful implementation of healthcare AI models and how to navigate the complexities of this critical phase in the AI lifecycle. Our goal is to provide you with the knowledge and insights you need to make informed decisions in your healthcare AI projects. ## Two Approaches to Implementation Before we delve into the details, it's important to understand the two main approaches to integrating a model into health IT systems. These are categorized as internal or external based on their relationship to the EMR. *Internal integration* of models means that developers rely exclusively on the tooling provided by the EMR vendor to host the model along with all of the logic around running it and filing the results.
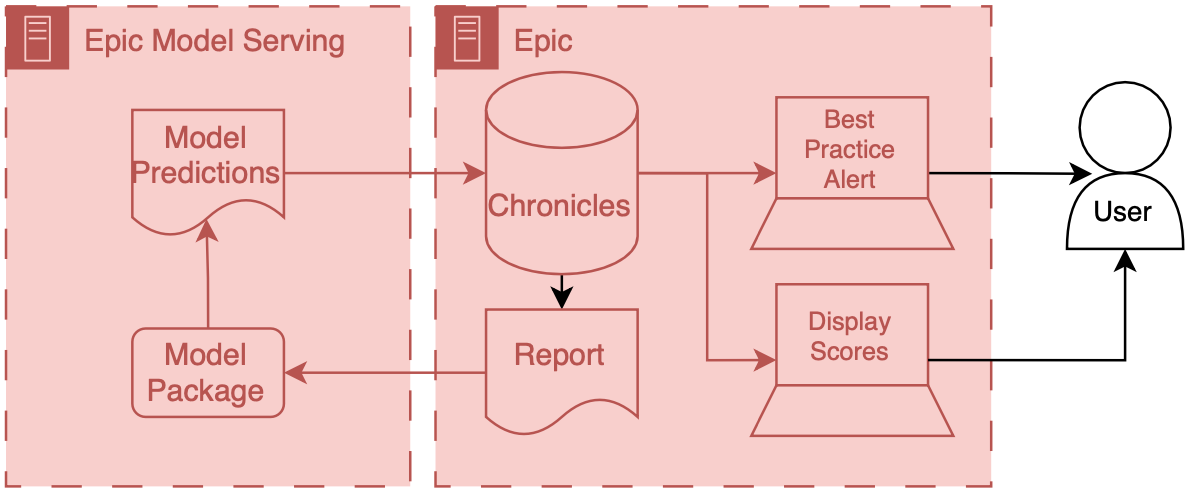
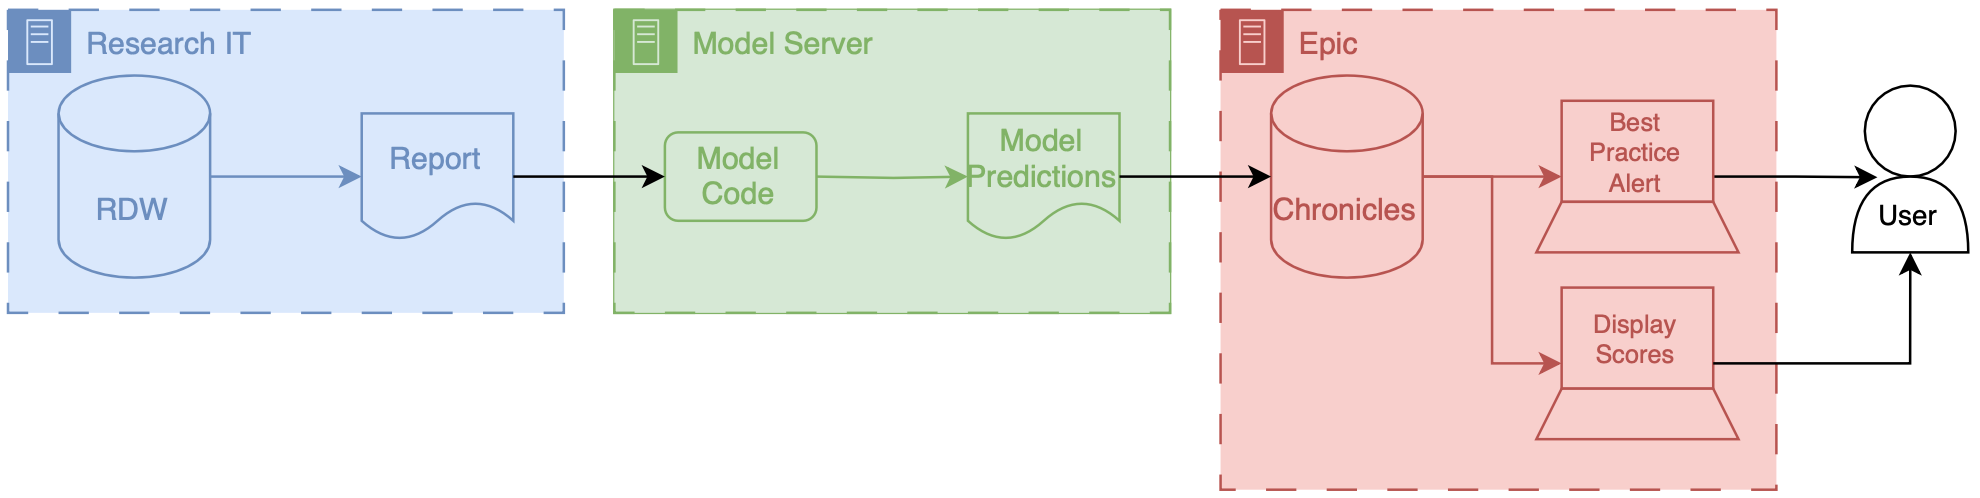
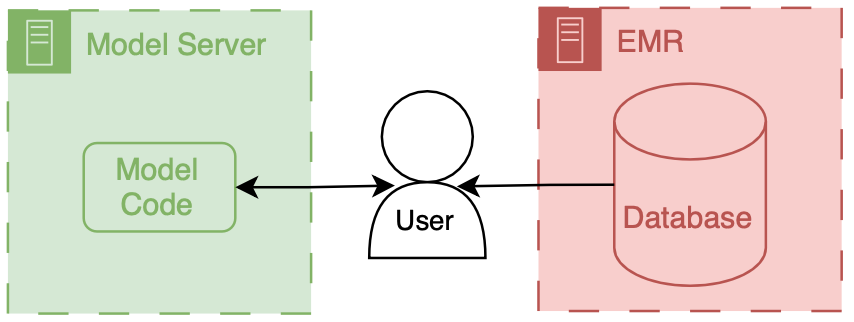
Erkin
[Go ÖN Home](https://eotles.com) ------------------------ File: 2024-09-20-Healthcare-AI-Infrastructure-MCURES.md Creation Date: "Fri, 27 Feb 2026 19:13:30 +0000" --- title: "M-CURES: AI Infrastructure for Predicting COVID-19 Deterioration in Hospitals" last_modified_at: 2024-09-22 categories: - Blog tags: - medicine - healthcare - artificial intelligence - machine learning - data science - FDA - clinical decision support - technology in medicine - implementation - implementation science - COVID-19 AI model - healthcare AI case study - in-hospital deterioration prediction - Epic integration - clinical AI tools - AI for acute care header: teaser: "/assets/images/insta/785385DC-5E5C-47B4-987D-E89D8DCBF9CB_1_105_c.jpeg" overlay_image: "/assets/images/insta/785385DC-5E5C-47B4-987D-E89D8DCBF9CB_1_105_c.jpeg" overlay_filter: 0.5 # same as adding an opacity of 0.5 to a black background excerpt: "A detailed exploration of the development and implementation of M-CURES, a COVID-19 in-hospital deterioration model, highlighting the integration of AI models into clinical workflows using Epic’s internal tools" meta_description: "Explore the development and implementation of the M-CURES AI model, used to predict in-hospital deterioration during COVID-19, with Epic integration insights." --- #AI Infrastructure Example: COVID-19 In-Hospital Deterioration In this post, we dive into a real-world application of healthcare AI infrastructure by exploring the Michigan Critical Care Utilization and Risk Evaluation System (M-CURES). This project was developed during the early stages of the COVID-19 pandemic to predict in-hospital deterioration for patients suffering from acute respiratory failure. This post builds on the broader concepts discussed in our previous posts on healthcare AI infrastructure. If you're unfamiliar with the foundational ideas behind AI development and implementation, I recommend starting with the [introduction to the healthcare AI lifecycle](/blog/Healthcare-AI-Lifecycle/) and the technical [overview of healthcare AI infrastructure](/blog/Healthcare-AI-Infrastructure/). These posts lay the groundwork for understanding how AI models are created and integrated into health systems, which will help contextualize the technical decisions made for M-CURES. This post focuses on our technical integration challenges while implementing M-CURES using Epic's internal tools and also demonstrates how you can parallelize development and integration. This parallelization enabled us to move quickly in a fast-moving, high-stakes environment like the early pandemic. By exploring the infrastructure and workflow that powered M-CURES, we'll also highlight the importance of collaboration between AI developers and health system analysts. This post builds off of our previous discussions on healthcare AI infrastructure. If you are unfamiliar with that infrastructure, reviewing the posts that cover the AI lifecycle or the general infrastructure landscape may be helpful. ## The Need: Implement Quickly In this post, we'll discuss the technical side of the Michigan Critical Care Utilization and Risk Evaluation System (M-CURES) project. We developed M-CURES as an in-hospital deterioration prediction system for patients admitted to the hospital for acute respiratory failure during the initial onset of the COVID-19 pandemic. In the early days of the pandemic, everyone was concerned with quickly triaging patients between different levels of care. We expected to see a massive influx of patients and wanted to be able to place them in the correct care setting (e.g., home, field hospital, regular hospital, ICU). To meet this anticipated need, Michigan Medicine leadership asked us to develop and implement a predictive model to help with triage. The development of the model and external validation are covered in a [paper we published in the BMJ](https://www.bmj.com/content/376/bmj-2021-068576). We discussed implementation exceptionally early in the project to speed up the process. Within the first week, we decided to implement the model we developed using Epic's tools (internal integration). Although it was our first time using Epic's tooling, we felt it would give us the best chance at the fastest integration process. After we decided to go with Epic's tooling, we started technical integration immediately. We did this work in parallel with model development to speed up the process as much as possible. ## Epic's Internal Integration Approaches As mentioned in the development infrastructure post, Epic provides tooling to facilitate internal technical integration. At the time we started the M-CURES project, Epic offered two options for internal integration: - Epic Cognitive Computing Platform (ECCP) and - Predictive Model Markup Language (PMML). Epic's [PMML](https://en.wikipedia.org/wiki/Predictive_Model_Markup_Language) approach is interesting because it implements the model by specifying a model configuration (using the [PMML standard](https://dmg.org/pmml/v4-4-1/GeneralStructure.html)). Epic builds/hosts a copy of the model based on their implementations of different model architectures. I have not built anything using this approach; however, my research at the time indicated that it was the more limited option, as only a handful of simple model architectures were supported. Because of the model architecture limitations of PMML, we decided to go with ECCP for M-CURES. ECCP enables you to host custom Python models using Epic's model-serving infrastructure. This model serving infrastructure is a sandboxed Python AI environment hosted using Microsoft Azure. At a high level, data are passed from Chronicles to this Azure instance; the model runs and produces predictions, which are then passed back to Chronicles. ECCP takes care of the data transitions, and AI developers primarily only need to worry about their AI code. ## Overview of ECCP
Erkin
[Go ÖN Home]() ------------------------ File: 2024-09-30-Healthcare-AI-Infrastructure-Overview.md Creation Date: "Fri, 27 Feb 2026 19:13:30 +0000" --- title: "Healthcare AI Infrastructure - To be deprecated" last_modified_at: 2024-04-11 categories: - Blog tags: - medicine - healthcare - artificial intelligence - machine learning - data science - FDA - clinical decision support - technology in medicine - implementation - implementation science header: teaser: "/assets/images/insta/785385DC-5E5C-47B4-987D-E89D8DCBF9CB_1_105_c.jpeg" overlay_image: "/assets/images/insta/785385DC-5E5C-47B4-987D-E89D8DCBF9CB_1_105_c.jpeg" overlay_filter: 0.5 # same as adding an opacity of 0.5 to a black background excerpt: "Infrastructure is king." --- NB: this series is still a work in progress. # Healthcare AI Infrastructure This post started as a brief overview of healthcare AI infrastructure and then grew into an unwieldy saga incorporating my perspectives on building and implementing these tools. As such, I split the post into a couple parts. This part provides a general introduction, aiming to ground the discussion in the existing HIT landscape and setting up the general approaches for development and implementation. This post is followed by detailed posts on development and implementation. In addition to providing more technical details these posts also walk through a couple projects that I've taken through the AI lifecycle. Discussing these projects will make the concepts a bit more concrete. ## Basic Healthcare IT Infrastructure Its important to ground our conversation in the basic healthcare information technology (HIT) infrastructure, primarily focusing on electronic medical records systems (EMRs). The reason for this is that the EMR is usually the source and destination of information processed by healthcare AI systems. Having a solid understanding of the parts of the EMR is the foundation to good healthcare AI infrastructure.


Erkin
[Go ÖN Home](https://eotles.com) [^1]: This can be complicated to do because you need to maintain you own application server and also deal with passing authentication between the EMR session and your application. [^2]: I've never done a cost break-down analysis for on-premises vs. cloud for healthcare AI research, but I'd love to see results if anyone has some handy. ------------------------ File: 2024-10-21-Healthcare-AI-Infrastructure-CDI.md Creation Date: "Fri, 27 Feb 2026 19:13:30 +0000" --- title: "AI Infrastructure Example: *C. difficile* Infection Risk" last_modified_at: 2024-04-12 categories: - Blog tags: - medicine - healthcare - artificial intelligence - machine learning - data science - FDA - clinical decision support - technology in medicine - implementation - implementation science header: teaser: "/assets/images/insta/785385DC-5E5C-47B4-987D-E89D8DCBF9CB_1_105_c.jpeg" overlay_image: "/assets/images/insta/785385DC-5E5C-47B4-987D-E89D8DCBF9CB_1_105_c.jpeg" overlay_filter: 0.5 # same as adding an opacity of 0.5 to a black background excerpt: "Discussion of the technical integration for an in-hospital infection risk stratification model." --- NB: this series is still a work in progress. This post builds off of our previous discussions on healthcare AI infrastructure. It may be helpful to review the posts that cover the general lay of healthcare IT land, development infrastructure, and implementation infrastructure. # *C. difficile* Infection Model We will be discussing the technical integration of a model that we have running at the University of Michigan. We developed this model with the intent to *C. difficile* infection risk stratification This is the model that we developed to integrated for *C. difficile* infection risk stratification.
Erkin
[Go ÖN Home](https://eotles.com) ------------------------ File: 2024-10-22-Healthcare-AI-Infrastructure-Technical-Integration-Testing.md Creation Date: "Fri, 27 Feb 2026 19:13:30 +0000" --- title: "AI Infrastructure: Technical Integration Testing" last_modified_at: 2024-05-08 categories: - Blog tags: - medicine - healthcare - artificial intelligence - machine learning - data science - FDA - clinical decision support - technology in medicine - implementation - implementation science header: teaser: "/assets/images/insta/785385DC-5E5C-47B4-987D-E89D8DCBF9CB_1_105_c.jpeg" overlay_image: "/assets/images/insta/785385DC-5E5C-47B4-987D-E89D8DCBF9CB_1_105_c.jpeg" overlay_filter: 0.5 # same as adding an opacity of 0.5 to a black background excerpt: "How do we ensure what we built actually works in production?" --- NB: this series is still a work in progress. This post builds off of our previous discussions on healthcare AI infrastructure. If you are unfamiliar with that infrastructure, it may be helpful to review the posts that cover the AI lifecycle or the general infrastructure landscape. # Overview ## Technical Integration Testing Although I've alluded to it, we haven't formally discussed testing side of integration yet. Testing all the components needed to technically implement the system is something that I refer to as *technical integration testing*. After careful consideration of clinical workflow it is one of the most important steps in the implementation process, imo. The basic premise of technical integration testing is to double check that you get the expected results from implementation components and that the system functions correct. This can be tricky because you need a good end-to-end understanding of the system and should approach each of the components from several different perspectives (software engineer, data engineer, ML engineer). Additionally, we don't have a standard toolbox to use when we are conducting technical integration testing. Although I didn't have a guide book, I tried to approach this process in a systematic manner through the course of the M-CURES project. I ended up creating several techniques that can be ... [TODO: transition] A couple of the techniques were simply around getting more information from the integration system. These involved closely examining the way data was being passed to and from the model. This is crucial because small changes in data format coming in can have big downstream consequences. As such we developed some techniques that allowed us to debug how our model was receiving and processing data. These techniques utilized the Python error console that Epic provided in the ECCP management dashboard. We built custom errors that helped assure that we were receiving and processing data in the correct manner. This process helped us refine our mental model of ECCP to align with the way it actually works. Part of the ECCP production debugging was inspired by another line of testing that we had conducted, which was diffing predictions. Diffing predictions grew out of a technique we had developed for [analyzing prospective performance degradation](https://proceedings.mlr.press/v149/otles21a/otles21a.pdf). The basic premise is straightforward. Run the same information through two different implementations of the same These techniques were: * ECCP Production Debugging * Diffing PatientLevel Predictions ECCP Production Debugging During this implementation process I developed 2 techniques that could ev some approaches for That being said, I did take a shot at doing a systematic This is an area I'm particularly interested in and hopefully I can convince some peer reviewers that It would be Its tricky as you have to you need to approach the system from a c During this process - slate vs. manually running the model - production debugging Cheers,
Erkin
[Go ÖN Home](https://eotles.com) ------------------------ File: 2026-02-19-UW-Trauma-Case-Conference-and-AI-Evaluation.md Creation Date: "Fri, 27 Feb 2026 19:13:30 +0000" --- title: "UW Emergency Medicine Trauma Case Conference, ED Thoracotomy, Pediatric Hematuria, and Evaluating Predictive AI" last_modified_at: 2026-02-19 categories: - Blog - Talk tags: - medicine - emergency medicine - trauma - resuscitative thoracotomy - pediatric trauma - hematuria - predictive models - artificial intelligence - healthcare AI header: teaser: "/assets/images/insta/44CDD86E-0463-4727-9B84-7C7A32C00329.jpg" overlay_image: "/assets/images/insta/44CDD86E-0463-4727-9B84-7C7A32C00329.jpg" overlay_filter: 0.5 # same as adding an opacity of 0.5 to a black background excerpt: "Two trauma cases, plus a pragmatic approach to evaluating predictive AI models at the bedside." --- # Trauma case conference, plus some AI evaluation Presentation for the University of Wisconsin - Madison, Department of Emergency Medicine Residency case conference. Ostensibly, the theme was trauma, however after an excellent joint trauma conference last week, I used part of this session to cover my approach to evaluating predictive AI models. (As always, details are educational, and cases are composites rather than identifiable real patients.) ## What we covered 1) When is an ED thoracotomy indicated? 2) Pediatric hematuria after blunt trauma, CT or observation? 3) How do you evaluate a predictive model that fires alerts? ## Slides [Link to download presentation.](https://eotles.com/assets/presentations/2026_UW_Trauma_AI_Case_Conference/2026_Trauma_AI_Case_Conference.pdf) ## ED thoracotomy supplemental videos and resources ### Clamshell Approach
Erkin
[Go ÖN Home](https://eotles.com) ------------------------